
Testing MCP Servers with MCP Inspector
MCP Inspector is a free browser tool for testing and debugging MCP servers. See raw messages, inspect schemas, and understand how LLMs use your tools.

Using and developing MCP (Model Context Protocol) servers is becoming increasingly common for software engineers. Over the past few months, I’ve been experimenting with both consuming and building MCP servers. One thing became clear early on: testing or debugging an MCP server is surprisingly difficult without the right tools.
Most of the time, you interact with MCP servers indirectly through an LLM or AI client, which makes it challenging to see raw MCP messages, understand tool schemas, inspect resources, or debug server behavior.
To help with this, I want to share a great free tool that my colleagues and I at work have found incredibly useful: MCP Inspector.
What MCP Inspector Can Do
MCP Inspector runs directly through npx, with no installation or setup required. When launched, it opens in your browser (on port 6274 by default) and provides a complete environment for understanding and testing MCP servers. It also gives you a better understanding of how LLMs use MCP servers to enhance their capabilities and knowledge.
Here are a few key features of MCP Inspector:
- MCP Server Support
- Works with MCP servers installed in your project (
npm,PyPI,uv, etc.). - Supports locally developed servers (great when running in watch mode).
- Supports publicly available MCP servers, including those that require authentication.
- Works with MCP servers installed in your project (
- Connection Pane
- Choose the transport (typically stdio).
- Provide a command and arguments for launching the server.
- Set environment variables.
- Save or load configurations using a
servers.jsonfile.
- Resources Tab
- Lists resources exposed by the MCP server.
- Shows metadata such as MIME type, title, and description.
(Note: not all servers expose resources)
- Prompts Tab
- Shows any prompt templates defined by the server.
- Allows testing them interactively. (Note: not all servers expose prompts)
- Tools Tab
- Displays all callable tools offered by the MCP server
- Shows the full schema, input definitions, and descriptions.
- Validates that responses match the server’s declared schema.
- Bonus: Dark Mode
- Supports both light and dark UI themes (this is a big deal for some folks)
Getting Started: Basic Usage
MCP Inspector offers a wide range of configuration options, but getting started is easy. This guide assumes you already have Node.js 22 or later installed. (Node.js 24 is the LTS version at the time of writing.)
Run MCP Inspector
You can start MCP Inspector without any configuration to verify it runs correctly. Run the following command:
npx @modelcontextprotocol/inspectorMCP Inspector should open automatically at: http://localhost:6274, and you should see a screen that looks similar to the screenshot below:
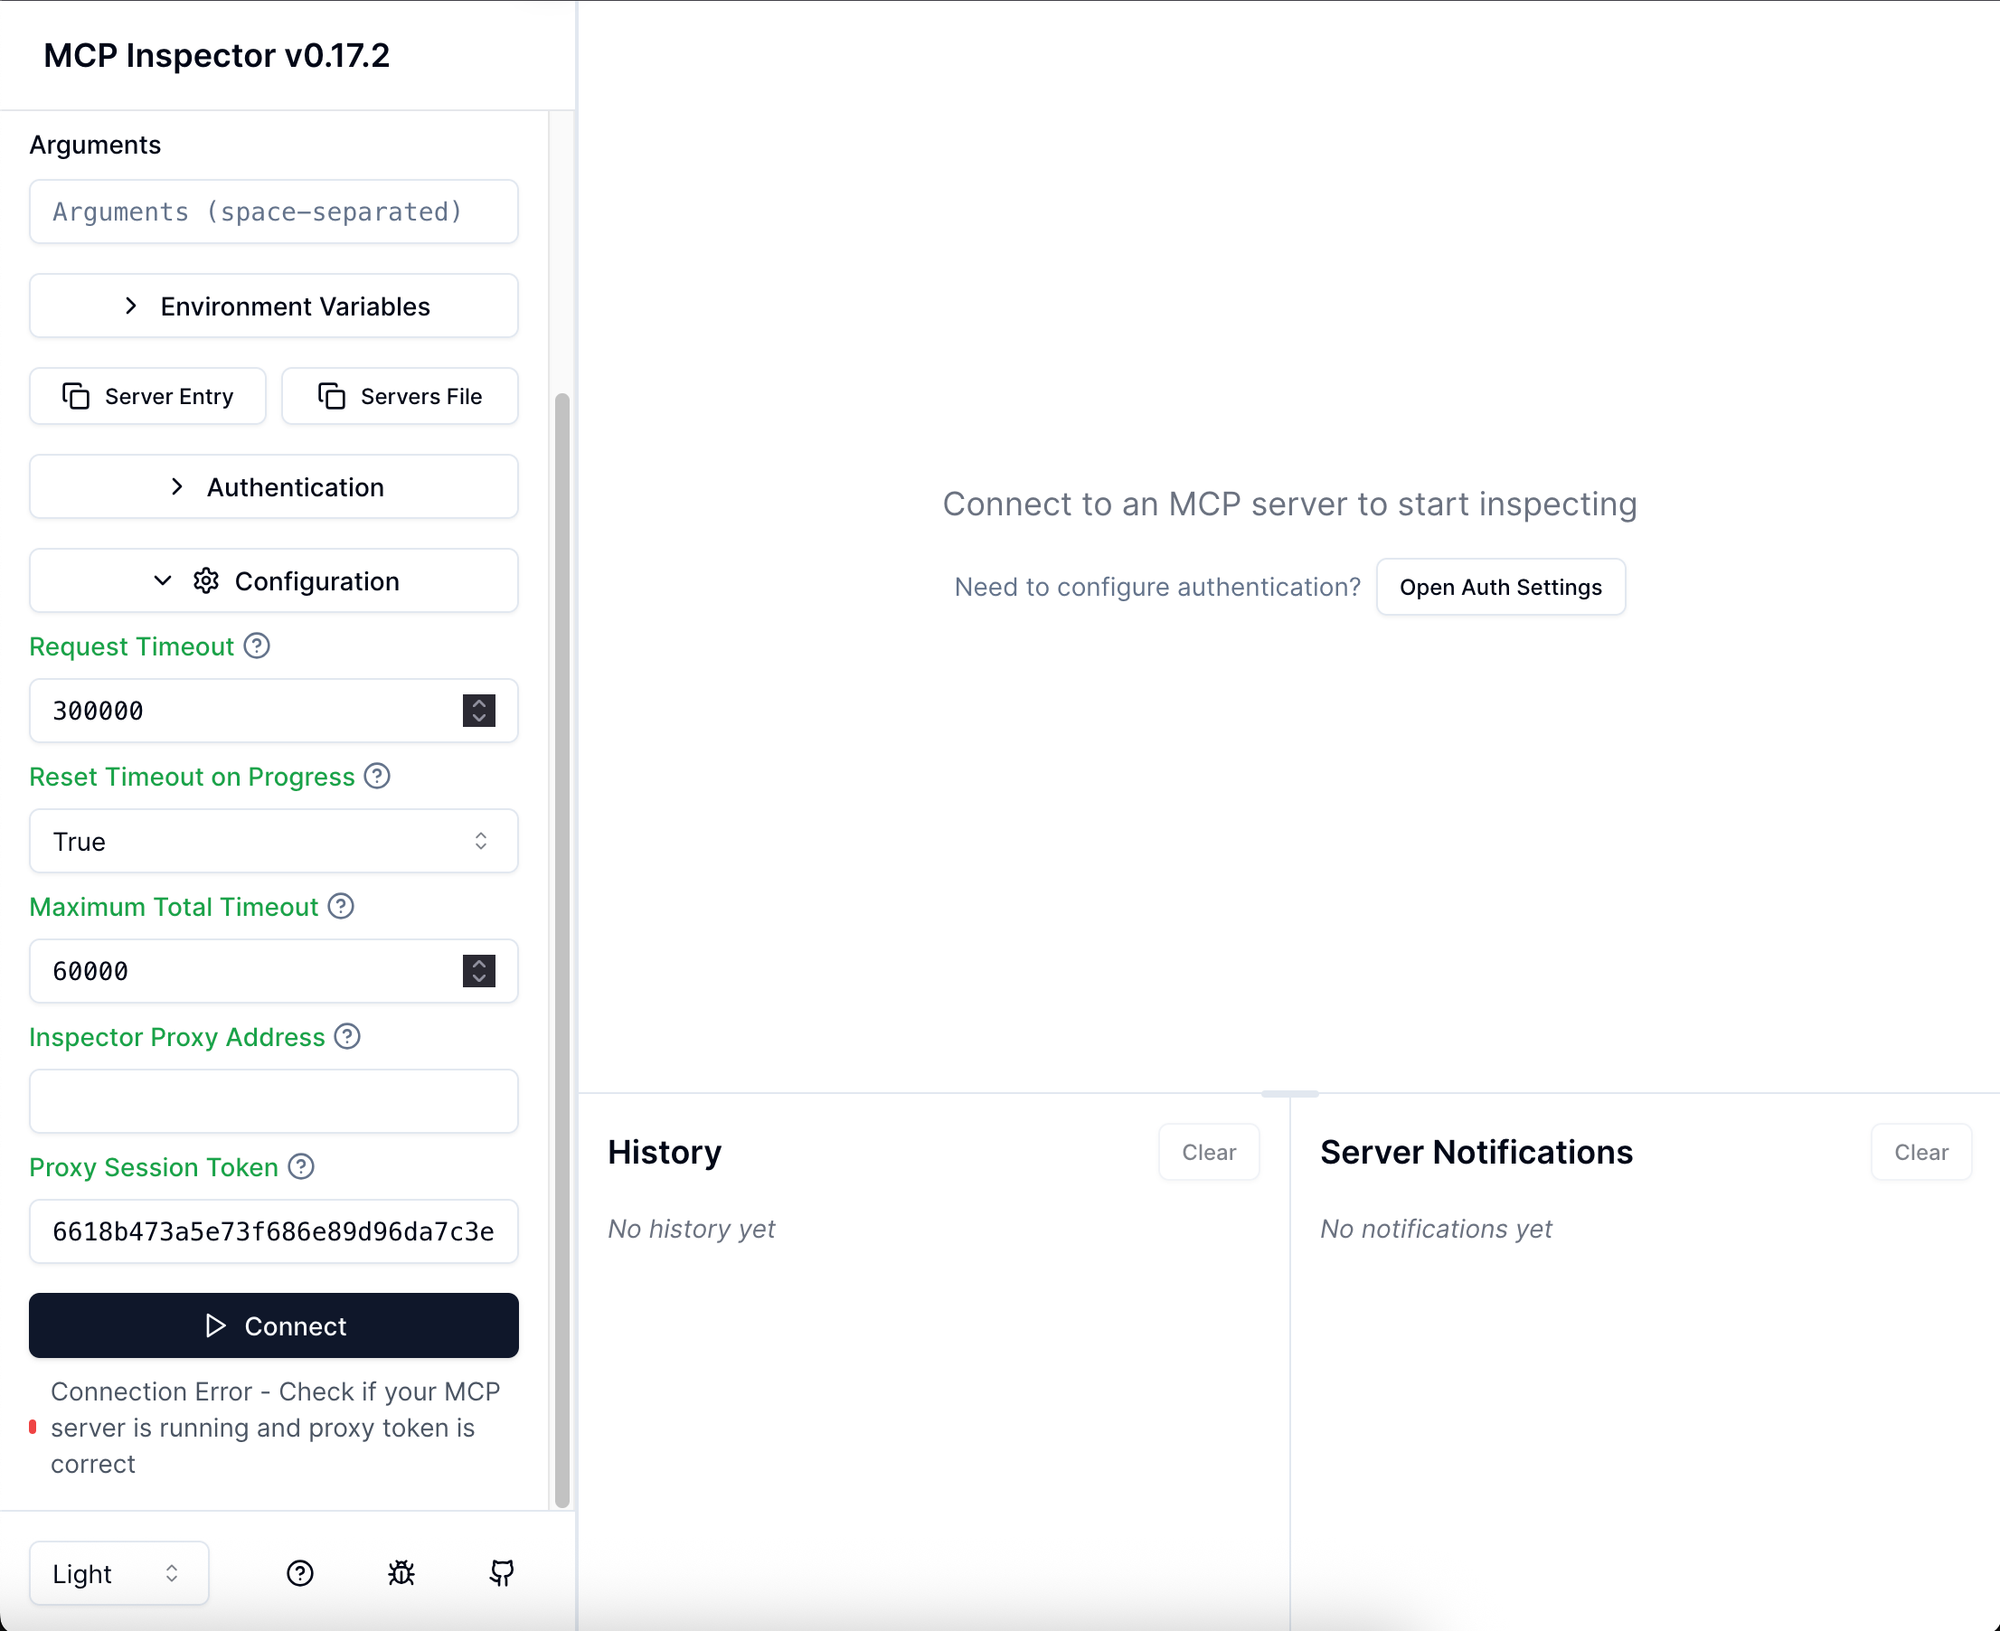
MCP Inspector Interface
Once the inspector loads in your browser, you’ll see:
Left Panel — Connection Setup
- Enter the command that starts your MCP server.
- Add optional arguments or environment variables.
- Choose between manually creating a server entry or loading from a config file.
- Adjust settings like timeouts and authentication.
Main Area
- History: Captures the raw MCP messages exchanged with the server.
- Server Notifications: Shows logs sent from the MCP server to the client.
- Tabs (once connected): Tools, Resources, Prompts, Auth, etc.
Example: Connecting MCP Inspector to the AWS Documentation MCP Server
The AWS Documentation MCP Server is a popular, publicly available server that returns AWS documentation, search results, and recommendations. It requires no authentication, making it a great first server to explore.
In real projects, your MCP server will typically be part of your codebase, and you’ll run it directly (e.g., npm run dev, uv run, or a compiled binary). MCP Inspector supports this just fine. However, for this example, we won’t install anything. Instead, we’ll let MCP Inspector launch the server directly using uvx.
Starting MCP Inspector with AWS Documentation MCP Server
Run the following command in your terminal:
npx @modelcontextprotocol/inspector \
  -e AWS_DOCUMENTATION_PARTITION=aws \
  uvx awslabs.aws-documentation-mcp-server@latest
Running this single command:
- Launches MCP Inspector
- Sets environment variables
AWS_DOCUMENTATION_PARTITION=awstells the server to use global AWS documentation rather than GovCloud or China partitions - Spawns the AWS Documentation MCP Server using
uvx - Automatically connects Inspector to the server
After clicking the "connect" button from the UI, you should see a screen that looks like the screenshot below (notice the green connection indicator in the left panel):
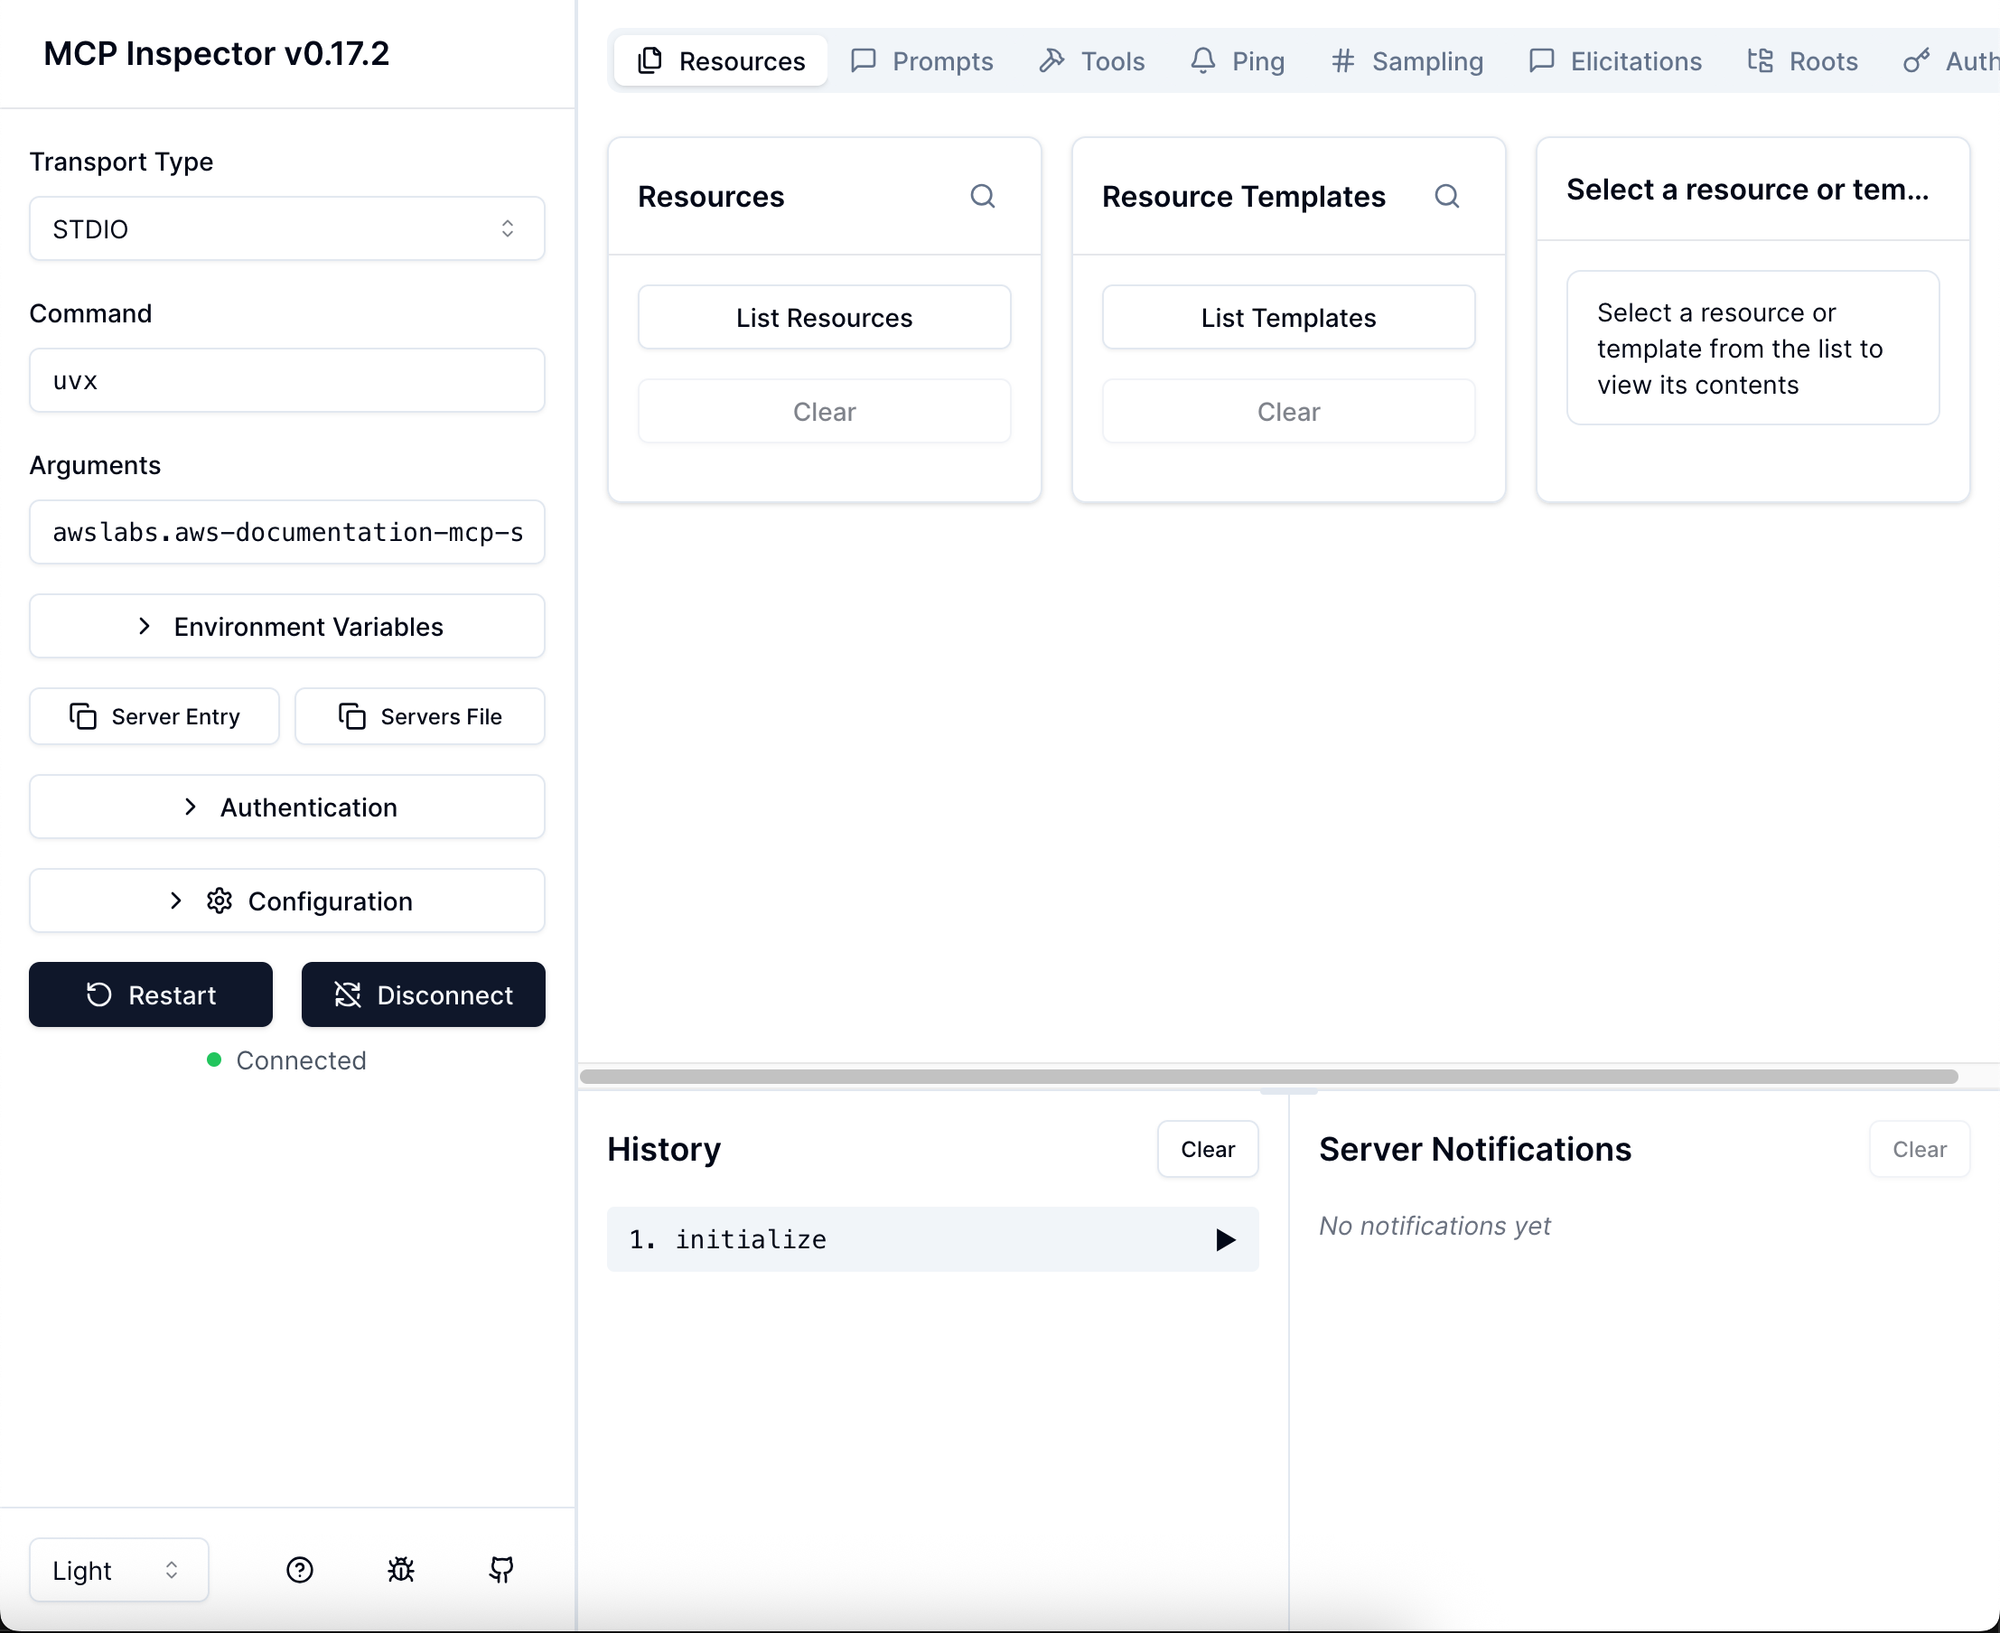
Note: The AWS Documentation MCP Server exposes tools only, which is common for this API-type MCP servers. It does not define prompts or resources, so those tabs will remain empty.
Using A Tool
Now that we’re connected to the AWS Documentation MCP Server, we can inspect the tools it exposes to AI agents or MCP clients. Click the Tools tab, then click List Tools to load the available operations:
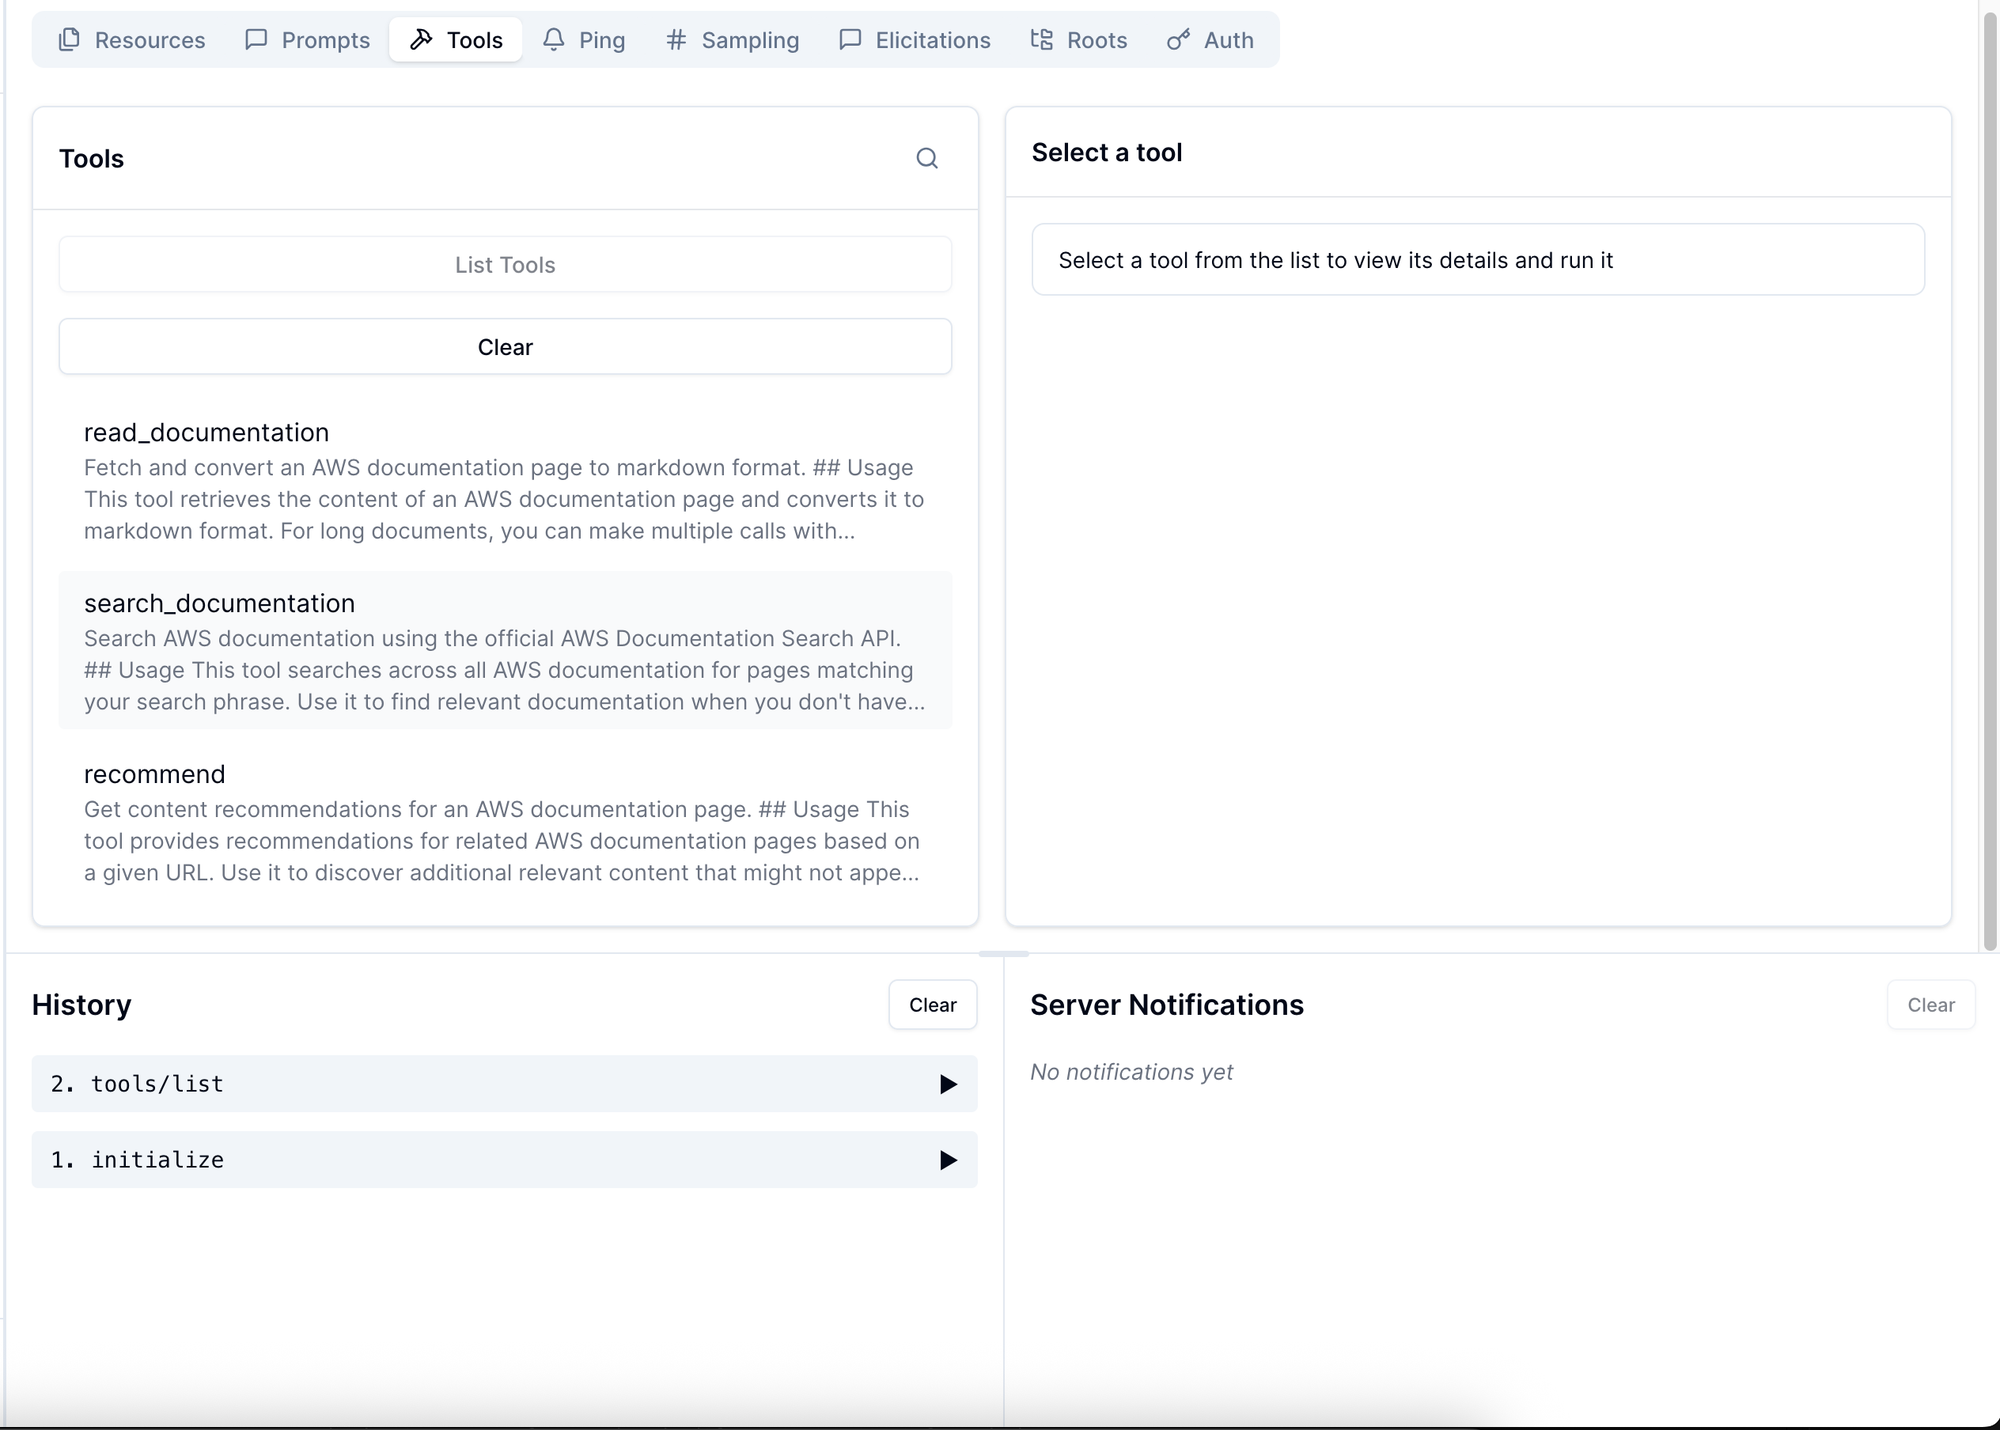
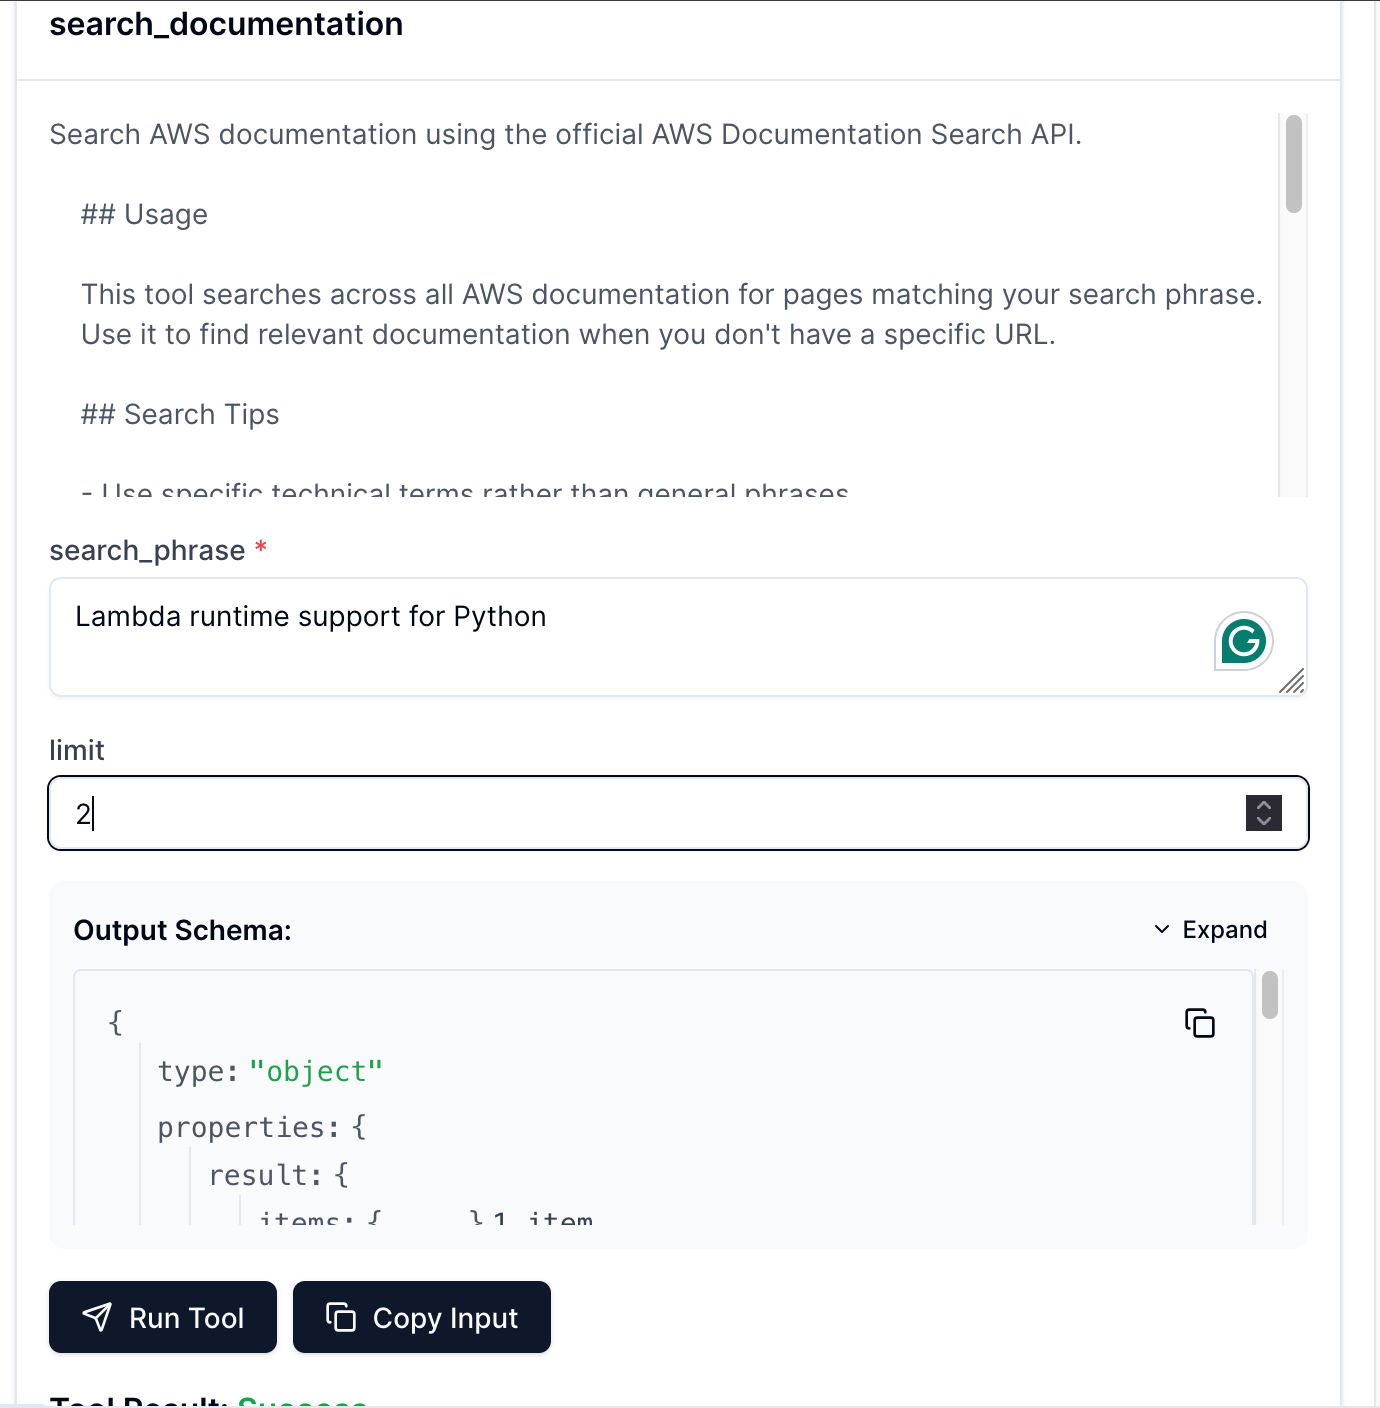
Next, select the search_documentation tool. The right panel will update to show the full schema, expected inputs, and description that an LLM would receive when calling this tool. MCP Inspector even provides a “Copy input” button if you want to reuse the call.
Try running a test search using:
- search_phrase:
Lambda runtime support for Python - limit:
2
Then click Run tool:
MCP Inspector will show both the request sent to the server and the validated response. Helpful copy buttons let you quickly copy either for debugging, documentation, or testing:
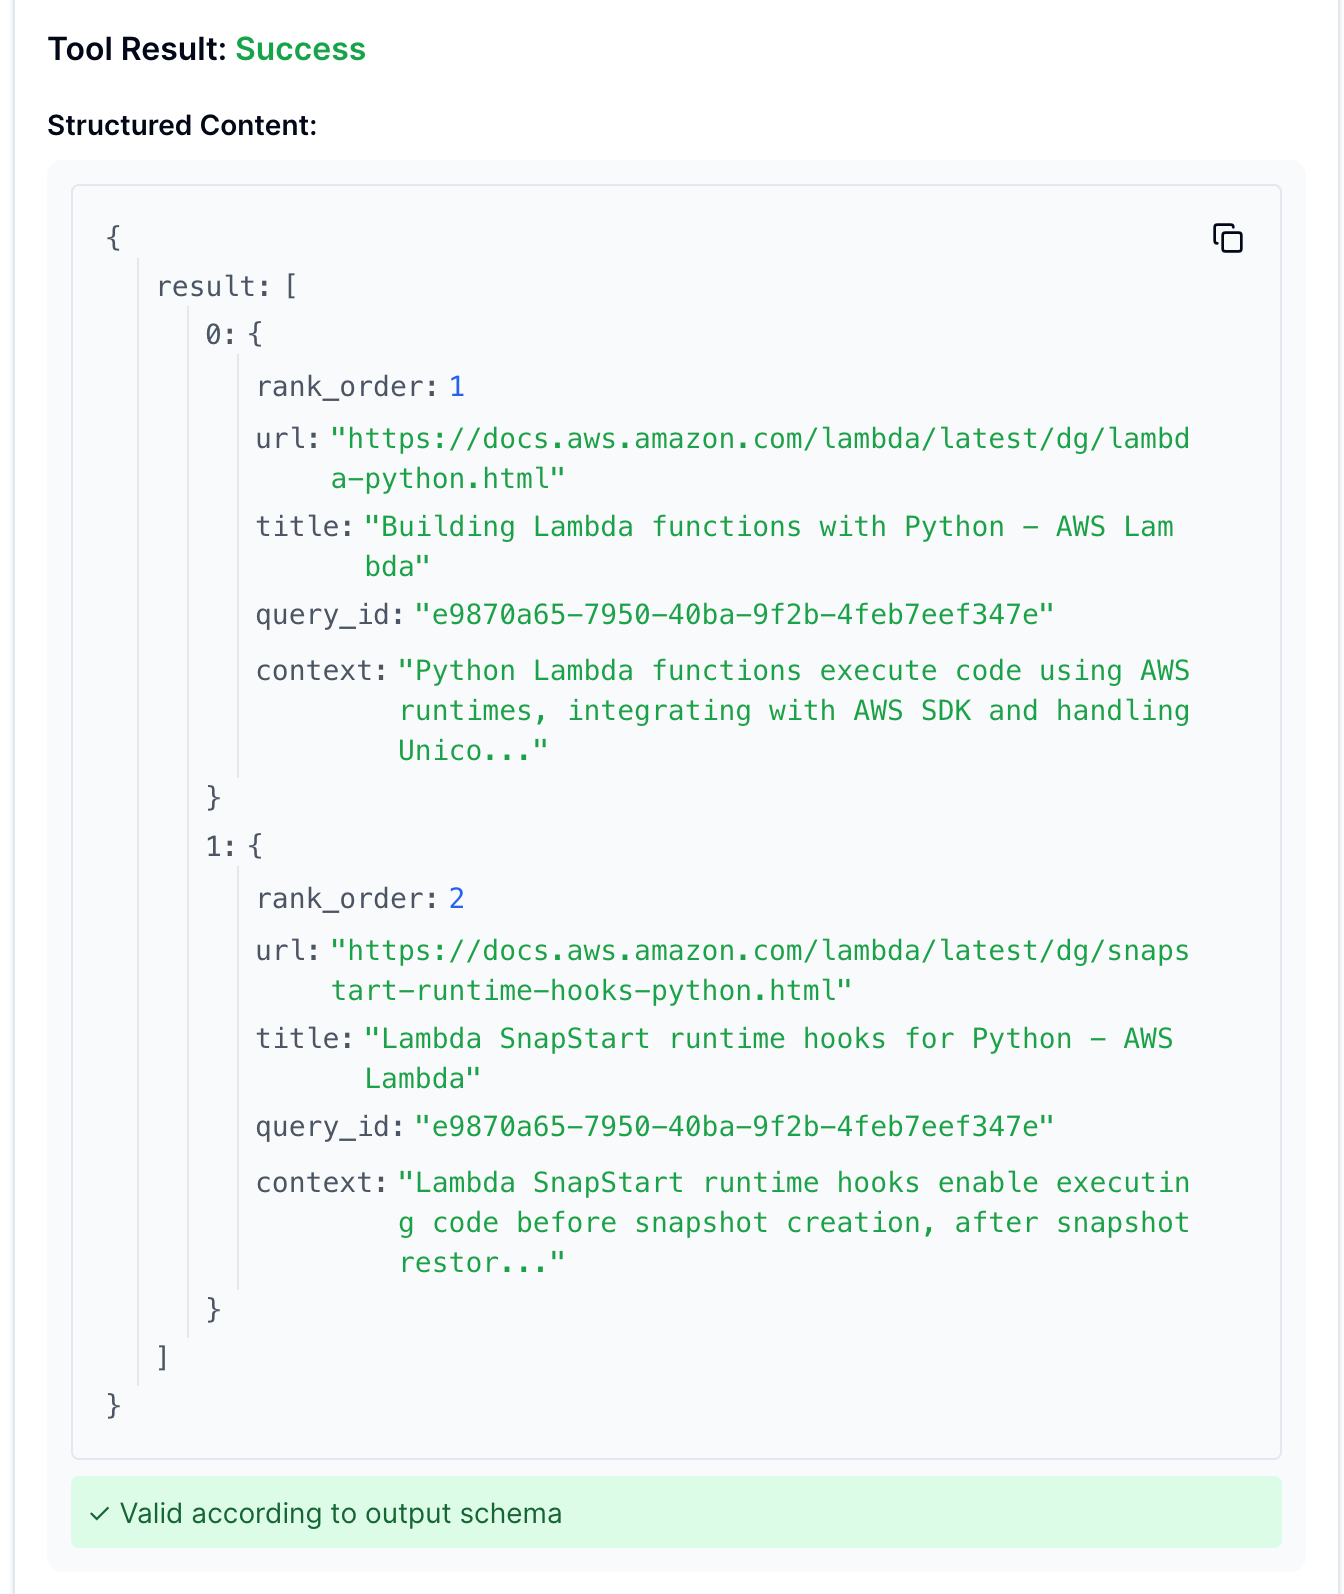
Using this tool provides a good example of how to use MCP Inspector and how to start inspecting and debugging MCP servers.
Next Steps
Once you’re comfortable with the basics, here are a few ways to continue exploring MCP Inspector:
1. Try Other Public MCP Servers
Many companies and OSS projects publish MCP servers:
- Filesystem servers
- Documentation servers
- Issue-tracking servers
- Git providers
- Knowledge base servers
- Cloud platform servers
Each one exposes different resources, prompts, or tools. The Awesome MCP Servers Site is a great way to discover more MCP servers.
2. Connect Your Own MCP Server
If you’re building an MCP server locally (Node, Python, Rust, Go, etc.), point MCP Inspector. Instructions for doing this are in the MCP Inspector README.MD on GitHub.
3. Use Inspector as Part of Your Development Workflow
If you regularly develop MCP servers, running Inspector side-by-side with your dev environment is a great development tool because it lets you:
- Inspect every message
- Validate schemas
- Debug tool execution
- Test prompts interactively
Summary
MCP Inspector is a free, surprisingly powerful tool for testing and debugging MCP servers. It also gives developers an inside look at how LLMs actually use the tools we build. It’s become one of my go-to utilities, so I wanted to pass it along to anyone who might find it helpful.