
See what your AI coding agent is doing with Datadog Lapdog
Datadog Lapdog is a free tool that gives you real-time visibility into what your AI coding agents are doing. Here's how to install it, pair it with Claude Code, and drill into a real session to see prompts, tool calls, token costs, and which model handled each step.

It’s important to have real-time visibility into what AI coding agents are doing. In May 2026, Datadog released Lapdog, a free local development tool that makes it easy to get these insights. If you want better visibility into what your agents are doing, Datadog Lapdog may be worth giving a try.
You can pair Lapdog with Claude Code, Codex, or Pi, and it shows the sessions, prompts, tool calls, and token costs in your browser as the agent runs. While you can get similar visibility with OTEL and a stack like Prometheus, Lapdog installs with a single command and provides a great, developer friendly experience. You don't have to be a Datadog customer to use this tool. By default, your session data remains on your local device. If you are a Datadog customer, you can optionally configure Lapdog to forward sessions to longer-term storage via an API key with the --forward option.
With Lapdog, there are two main components that make it work. First, there’s a local agent (dd-apm-test-agent) that listens on localhost:8126 and captures session information. Second, there’s a dashboard hosted at lapdog.datadoghq.com. While this site is internet-accessible, the browser only reads directly from your machine via localhost. If you decide Lapdog isn’t for you, you can easily remove it in a few steps.
Lapdog captures sessions in two different ways. First, the agent runs as a proxy to capture model request traffic. This allows the agent to gather prompts, responses, and token metrics. Second, Lapdog subscribes to be notified via non-blocking hooks to events such as tool calls, permission events, and lifecycle events. Lapdog has different levels of support depending on the agent. For example, both Claude Code and Codex agents are monitored via proxy and hooks. However, Pi is currently only monitored with hooks.
As an aside, this implementation is a great example of interesting capabilities you can add to coding agents using hooks.
Getting started
Datadog Lapdog currently supports instrumenting the Claude Code, Codex, and Pi agents. Since I use the Claude Code agent most in my free time (and have a personal Max subscription), the rest of this post will focus on Claude in the examples. However, your experience will be very similar using Codex or even Pi.
You can install Lapdog on macOS, Linux, or Windows, or use its Docker image.
I use a Mac for personal development, so the one-line installation option makes it easy to get started. On macOS machines with Brew installed, you can install Lapdog with a single command:
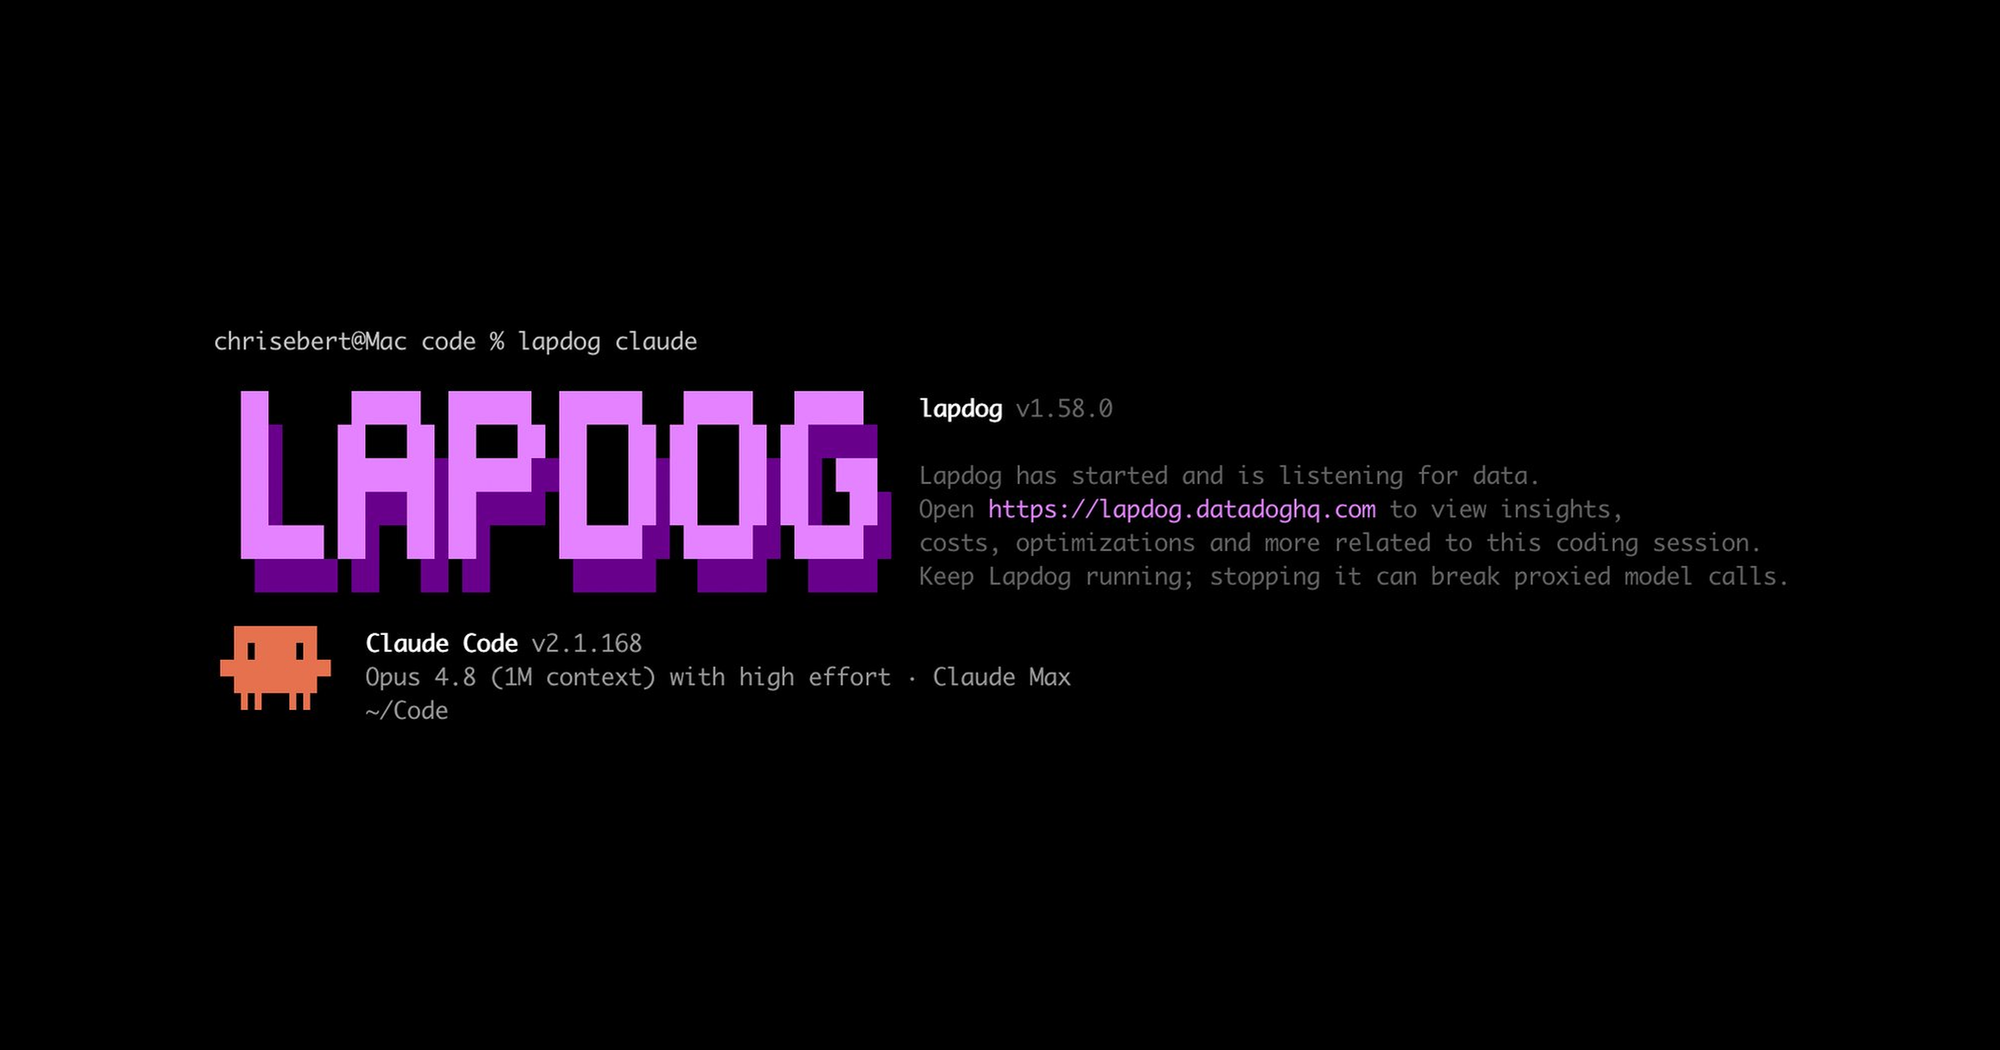
brew install datadog/lapdog/lapdogAfter installing Lapdog, you need to install the Lapdog plugin in order to register the non-blocking hooks with your coding agent. Lapdog will do the setup for your coding agent for you. For example, you can set up the hooks in Claude Code by running:
lapdog claude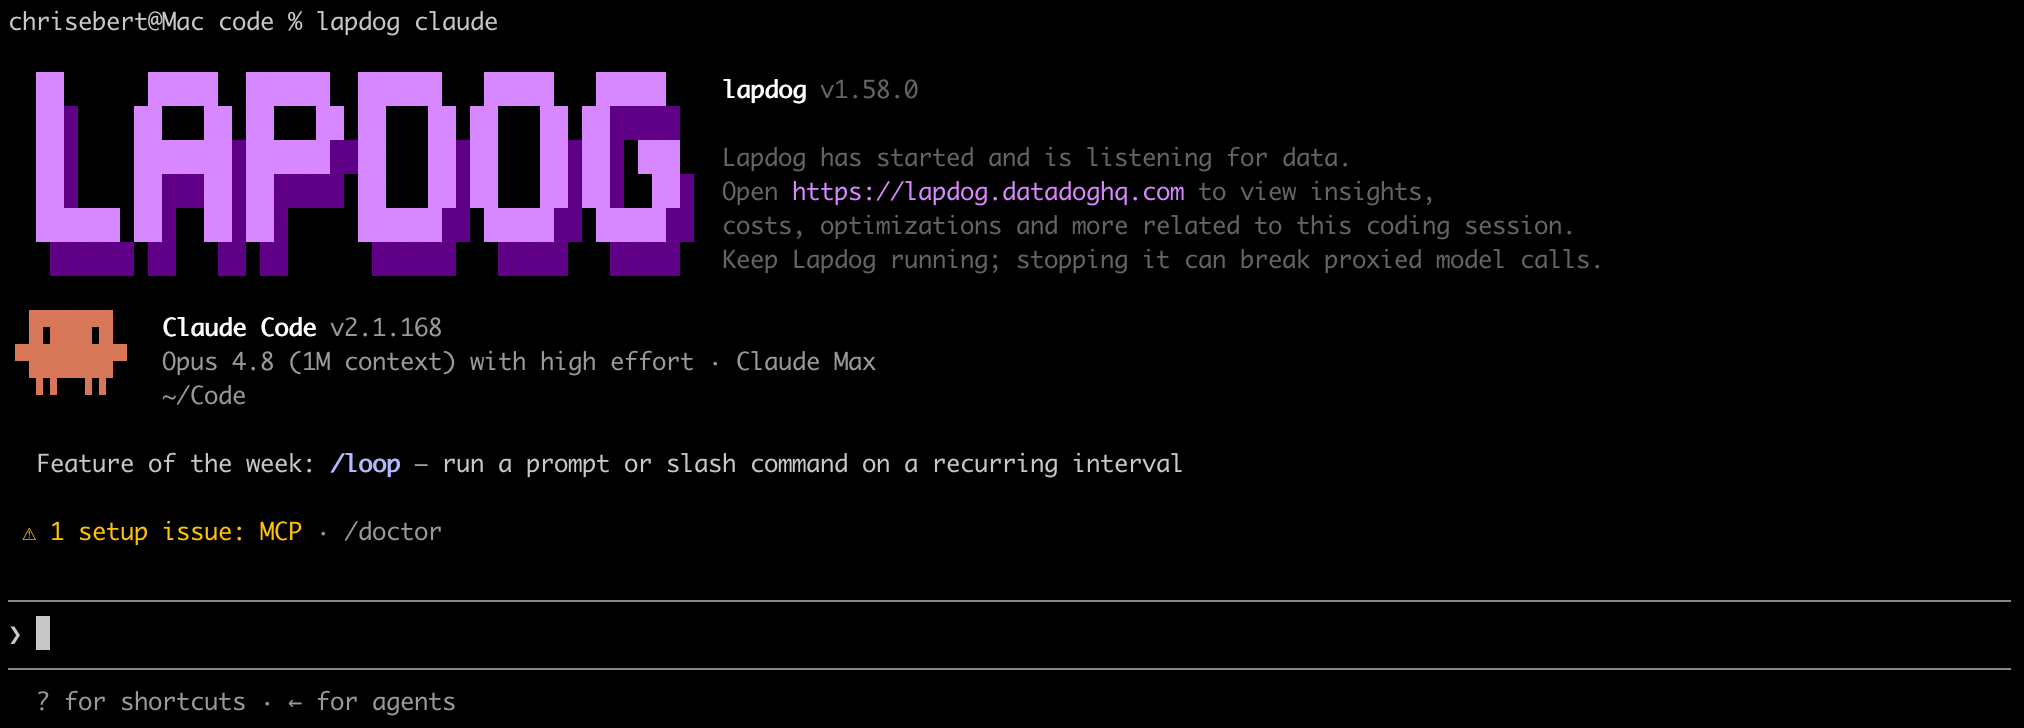
Note: Sessions launched as plain claude or codex only send hook events to Lapdog, which carry no token usage at all. If you want to gather token usage information, you must launch your agent with the proxy path (lapdog claude).
If you're not on macOS or want the full list of install options, commands, and flags, they're documented on the Lapdog documentation page. Additionally, the agent's source code is available in the dd-apm-test-agent repository which is helpful to reference if you want a better understanding of how this tool works.
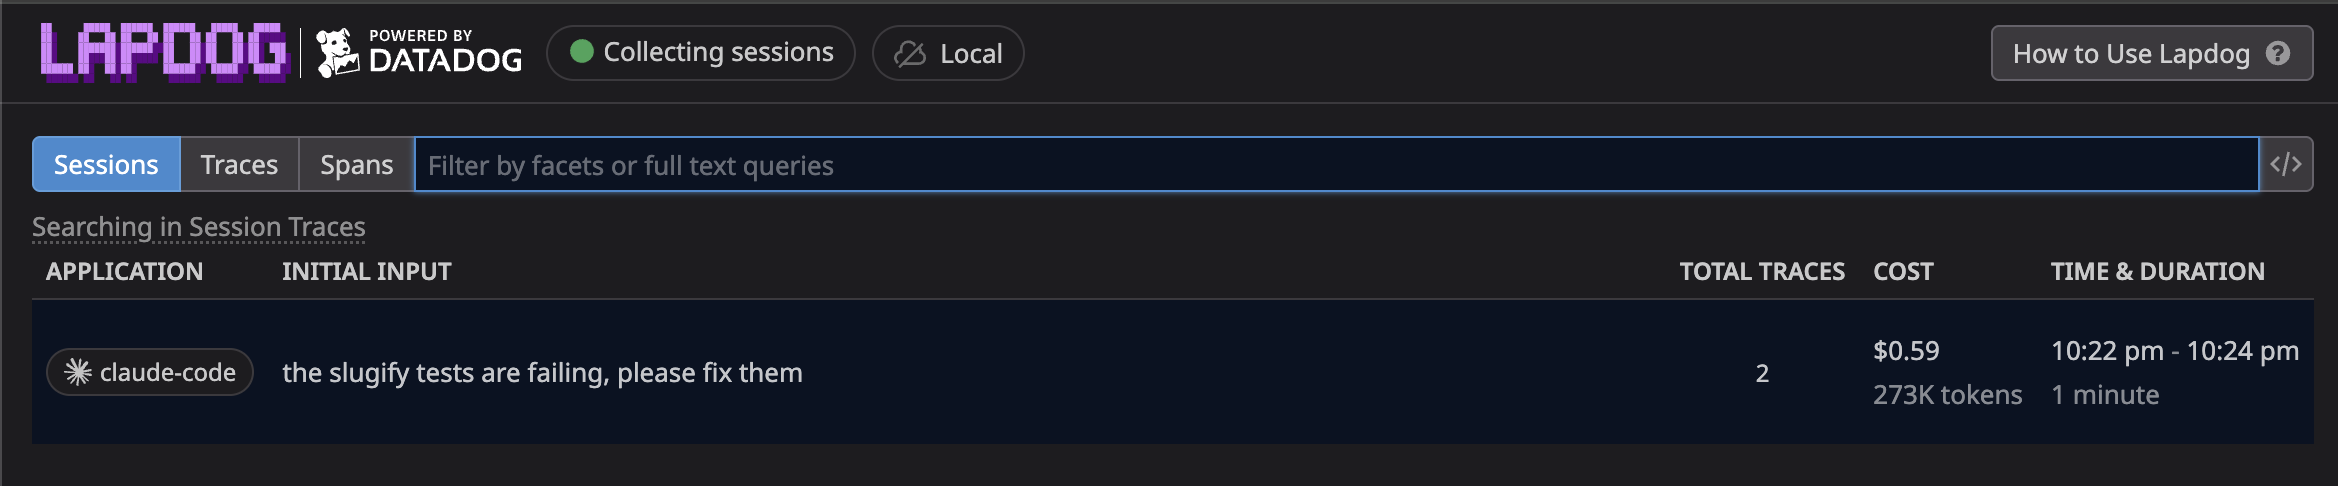
If everything is set up correctly, you should be able to visit lapdog.datadoghq.com and view your session dashboard like the example below:
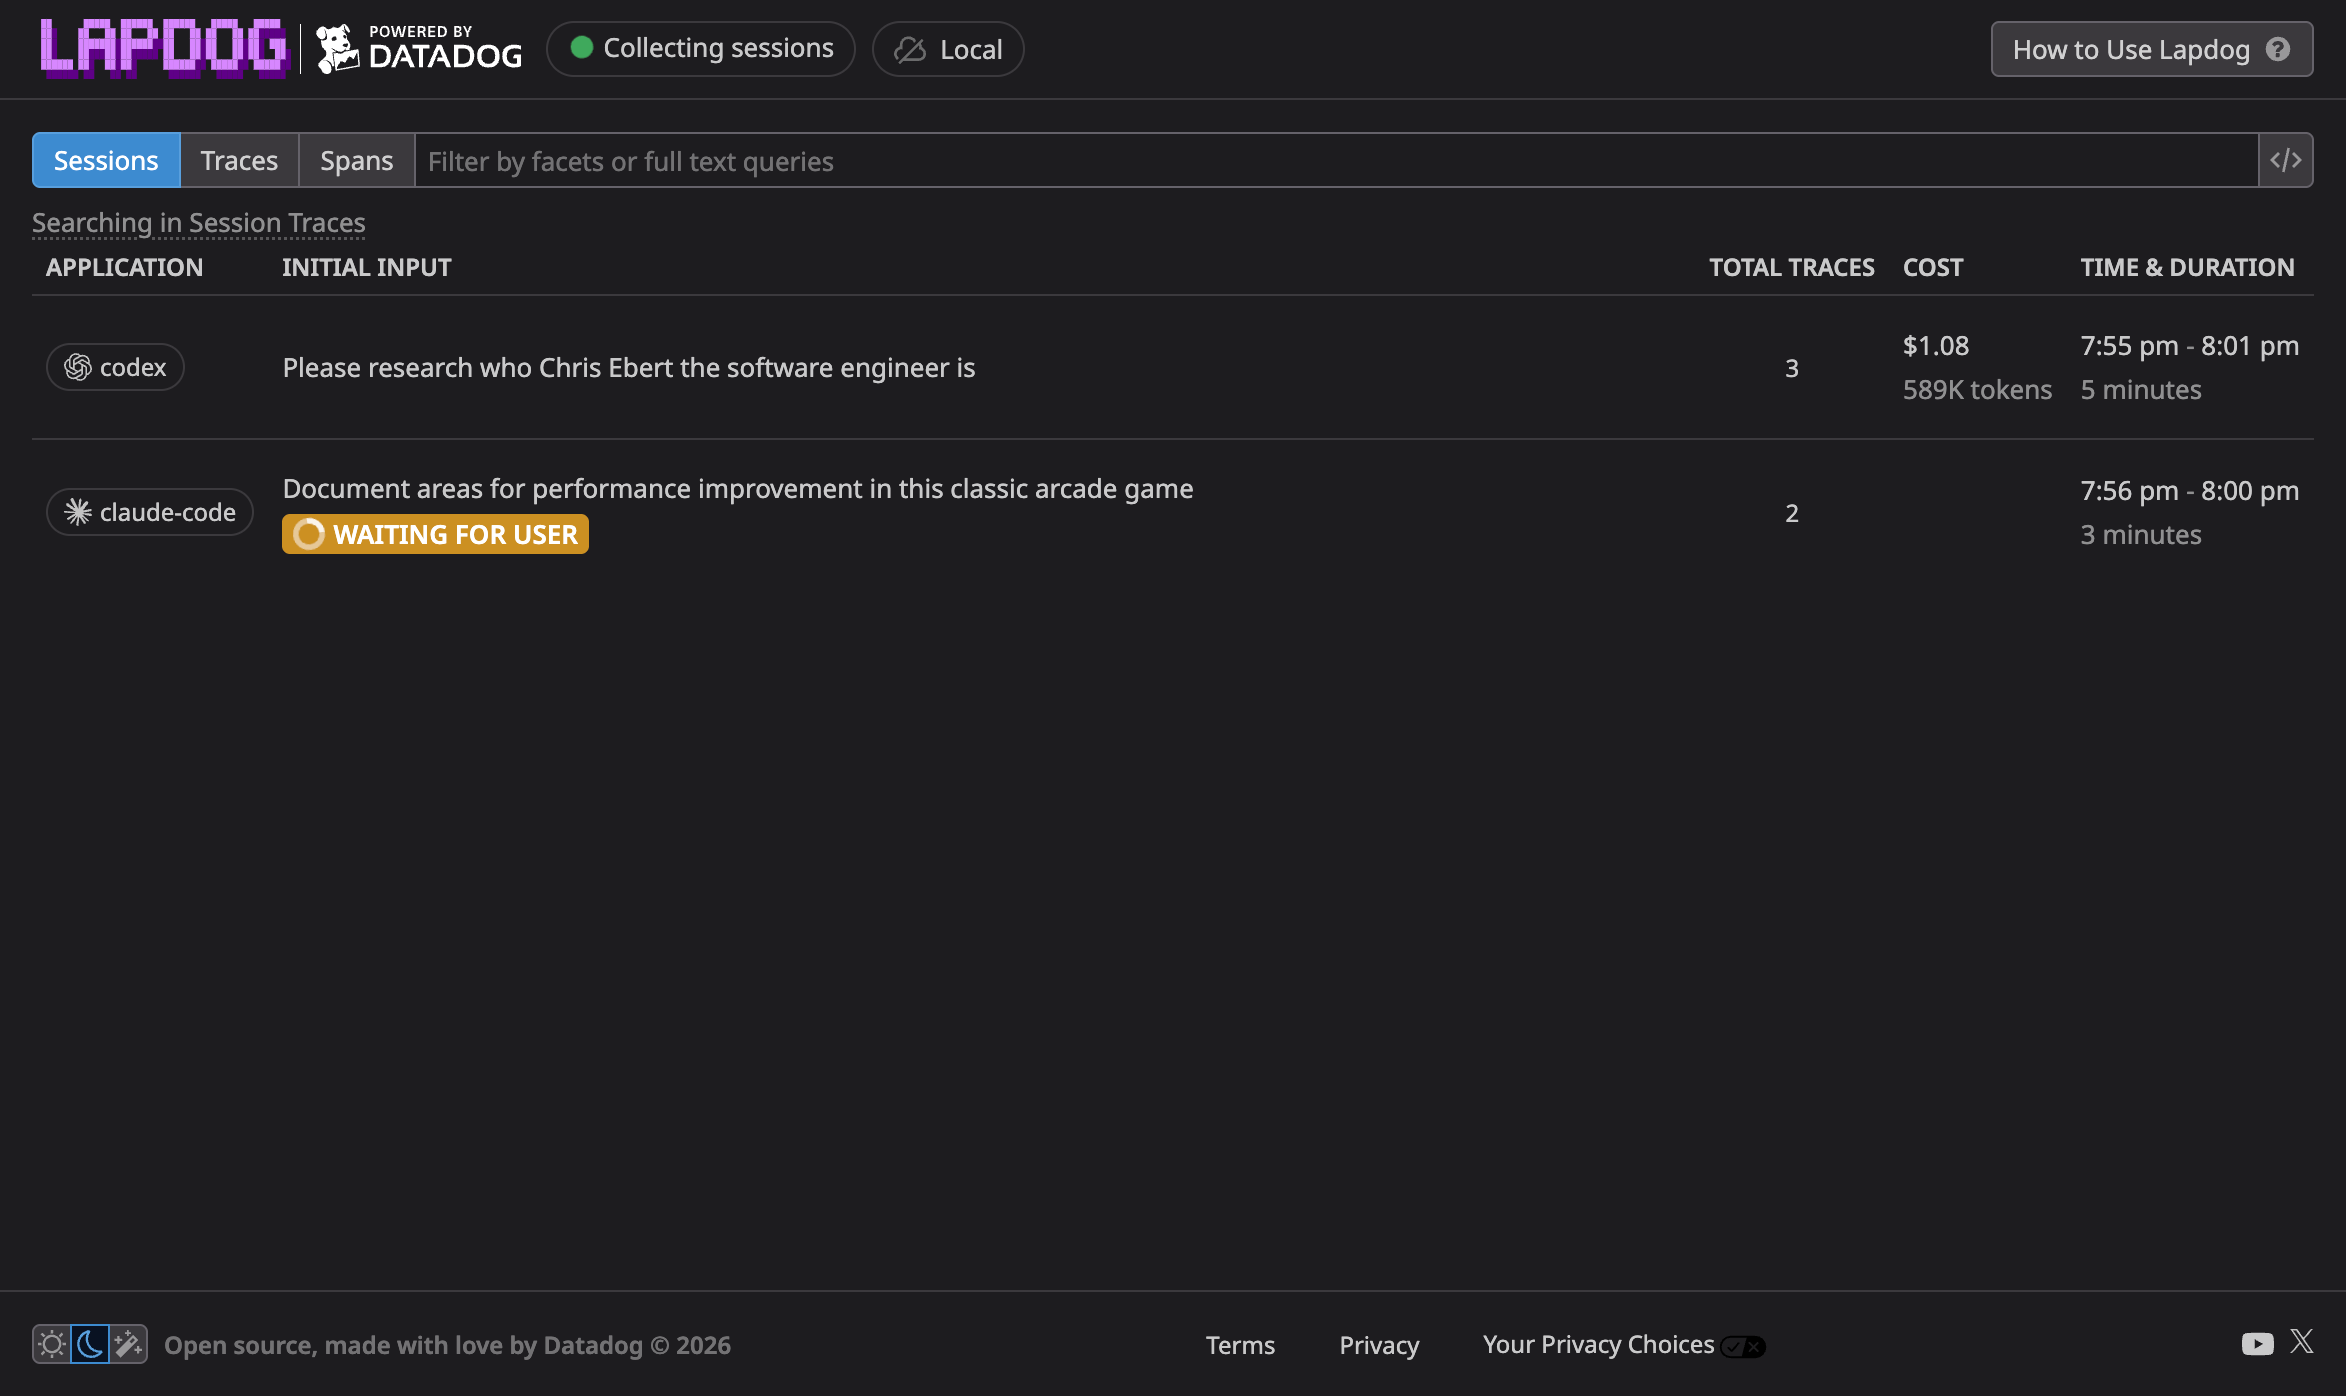
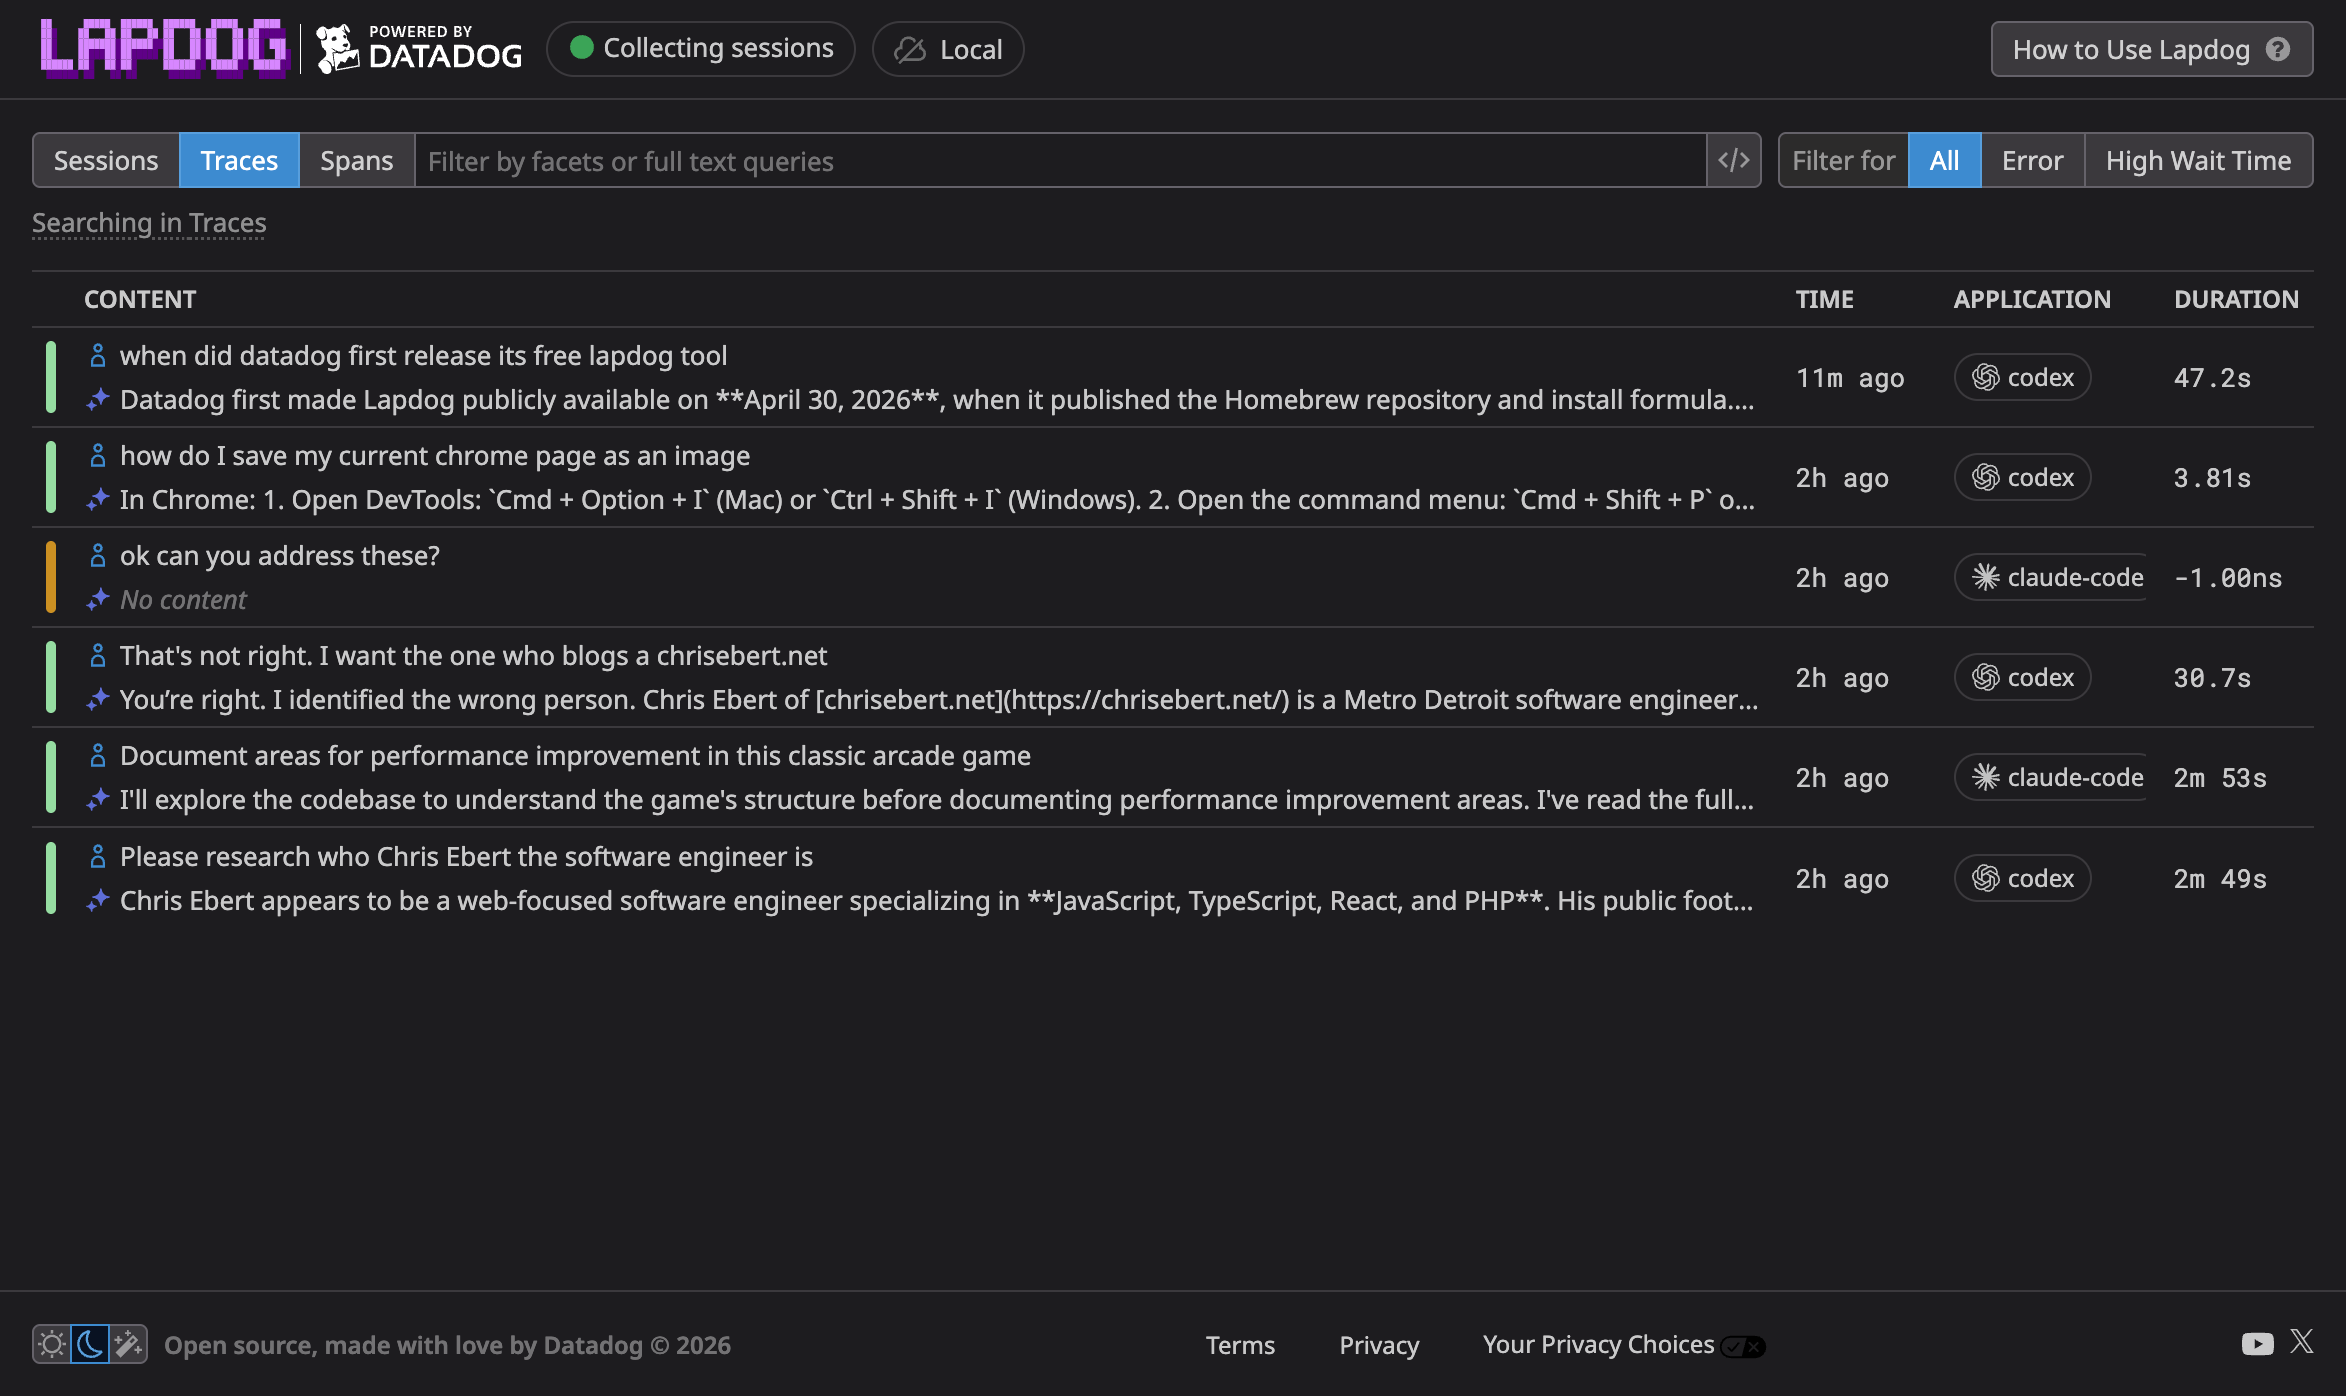
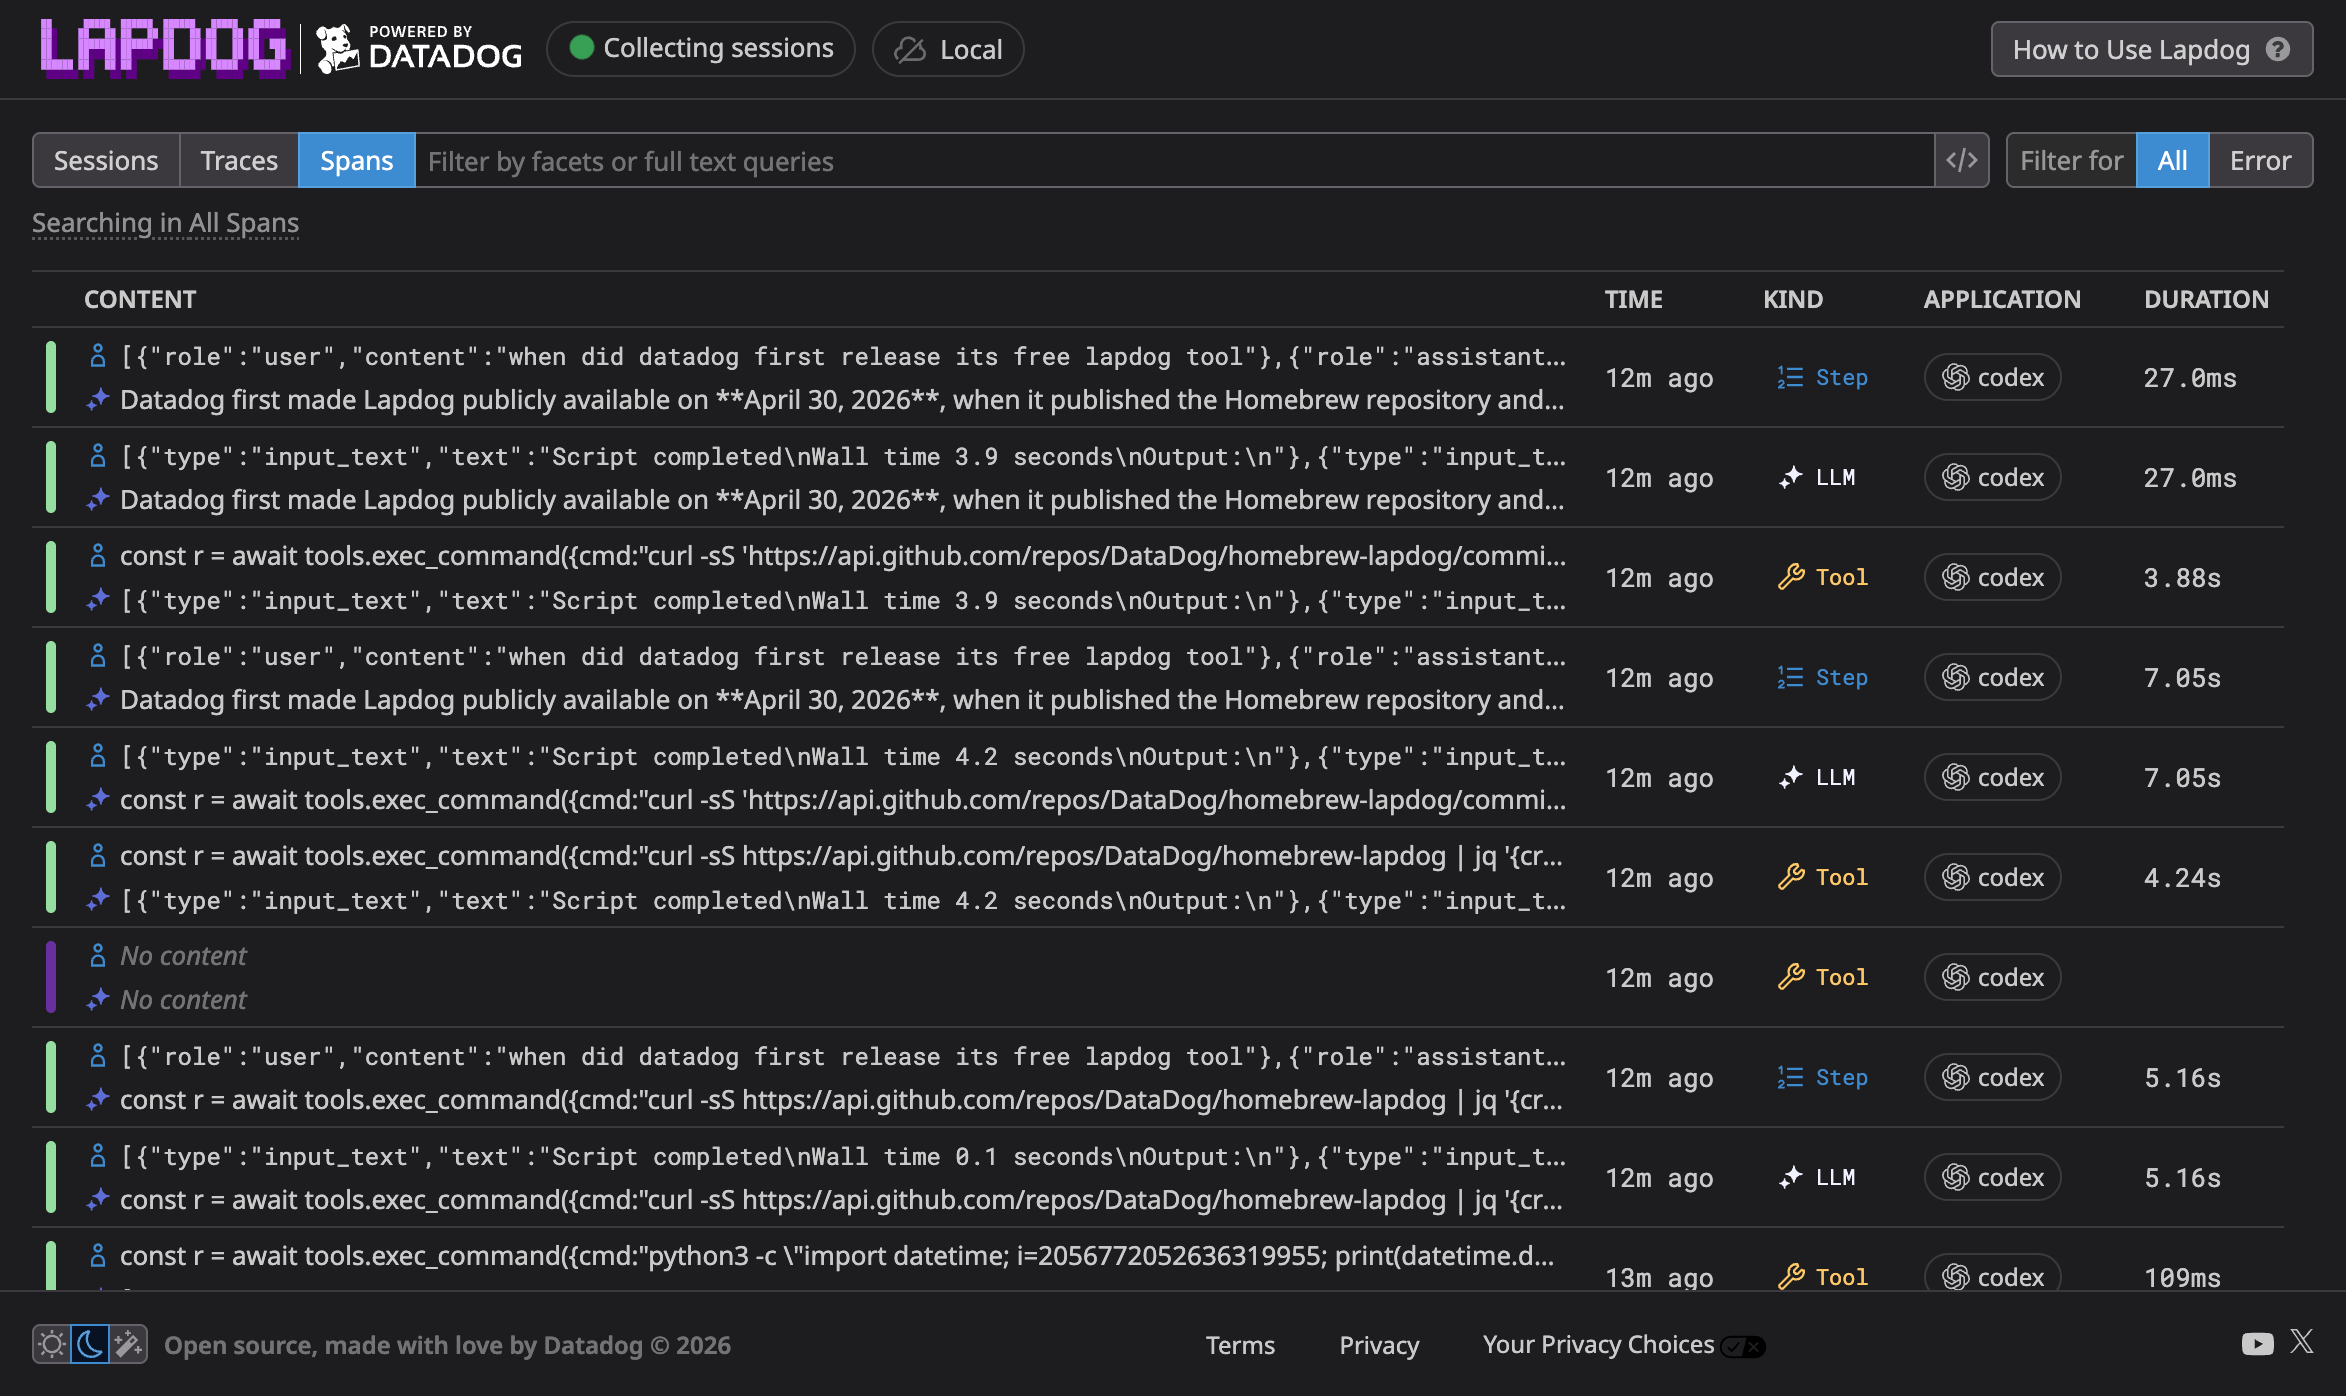
Once you load the dashboard, you can switch between sessions, traces, and spans views. Lapdog traces are timelines of what an AI coding agent did during a task:
A span is one operation within a trace:
Session management
It's worth noting that Lapdog only keeps sessions in the local agent's memory. If you restart your computer or the agent, prior sessions will be lost unless you opt in to the Datadog forwarding integration.
If you leave your computer running for several days or are a heavy LLM user, it may be helpful to clear out previous sessions. You can do this by simply restarting the Lapdog agent:
lapdog stop && lapdog startThis stops the background service, which clears out the sessions, and leaves you with an empty dashboard.
Seeing a real session
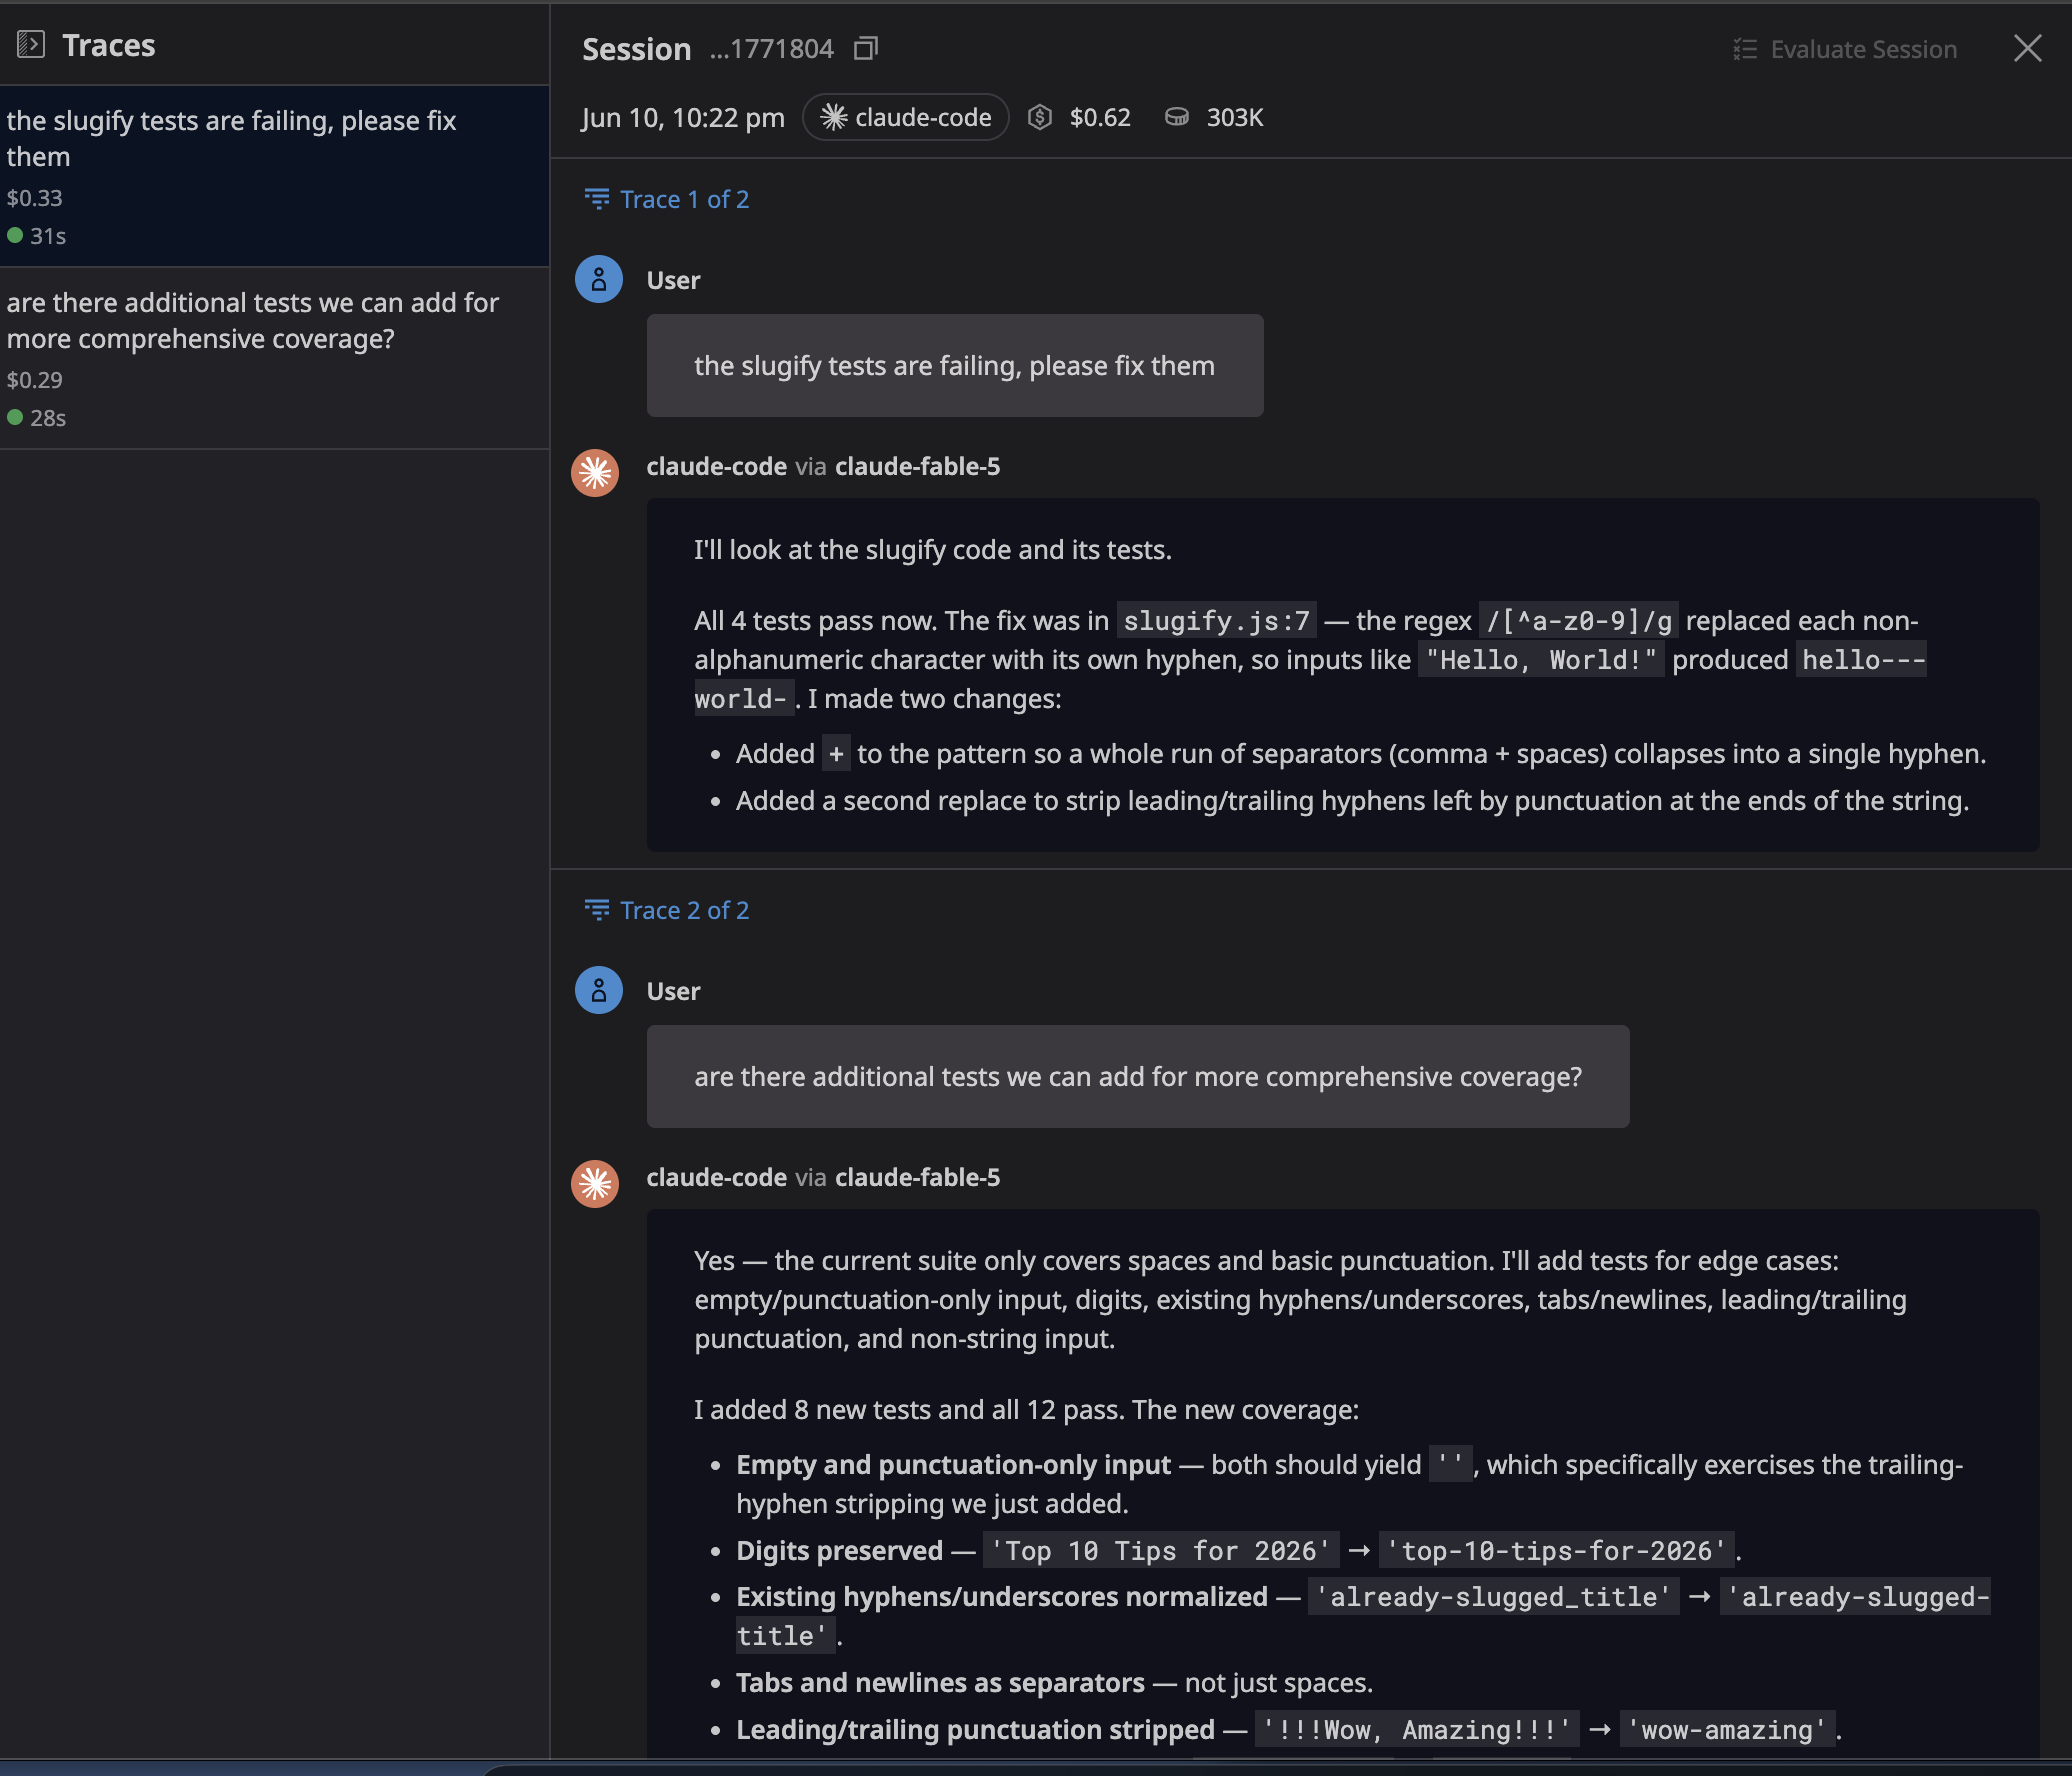
My favorite way to use Lapdog is to select a session of interest from the dashboard and click on it to drill into it. I created a small scratch repo at ~/Code/lapdog-demo with a buggy slugify.js and a slugify.test.js suite where two of the four tests fail on purpose. With Lapdog running, I opened Claude Code in the repo and prompted it with > the slugify tests are failing, please fix them.
Once it finished, I switched over to lapdog.datadoghq.com and opened the session view. The run shows up as a single session with its prompt, duration, and total token cost right in the list:
Clicking into that session is where it gets interesting. We can see the traces from my session. I first asked Claude to fix the failing tests and later asked it to add more comprehensive coverage:
We can click on the first trace to drill down into everything the agent did to get from "two failing tests" to green:
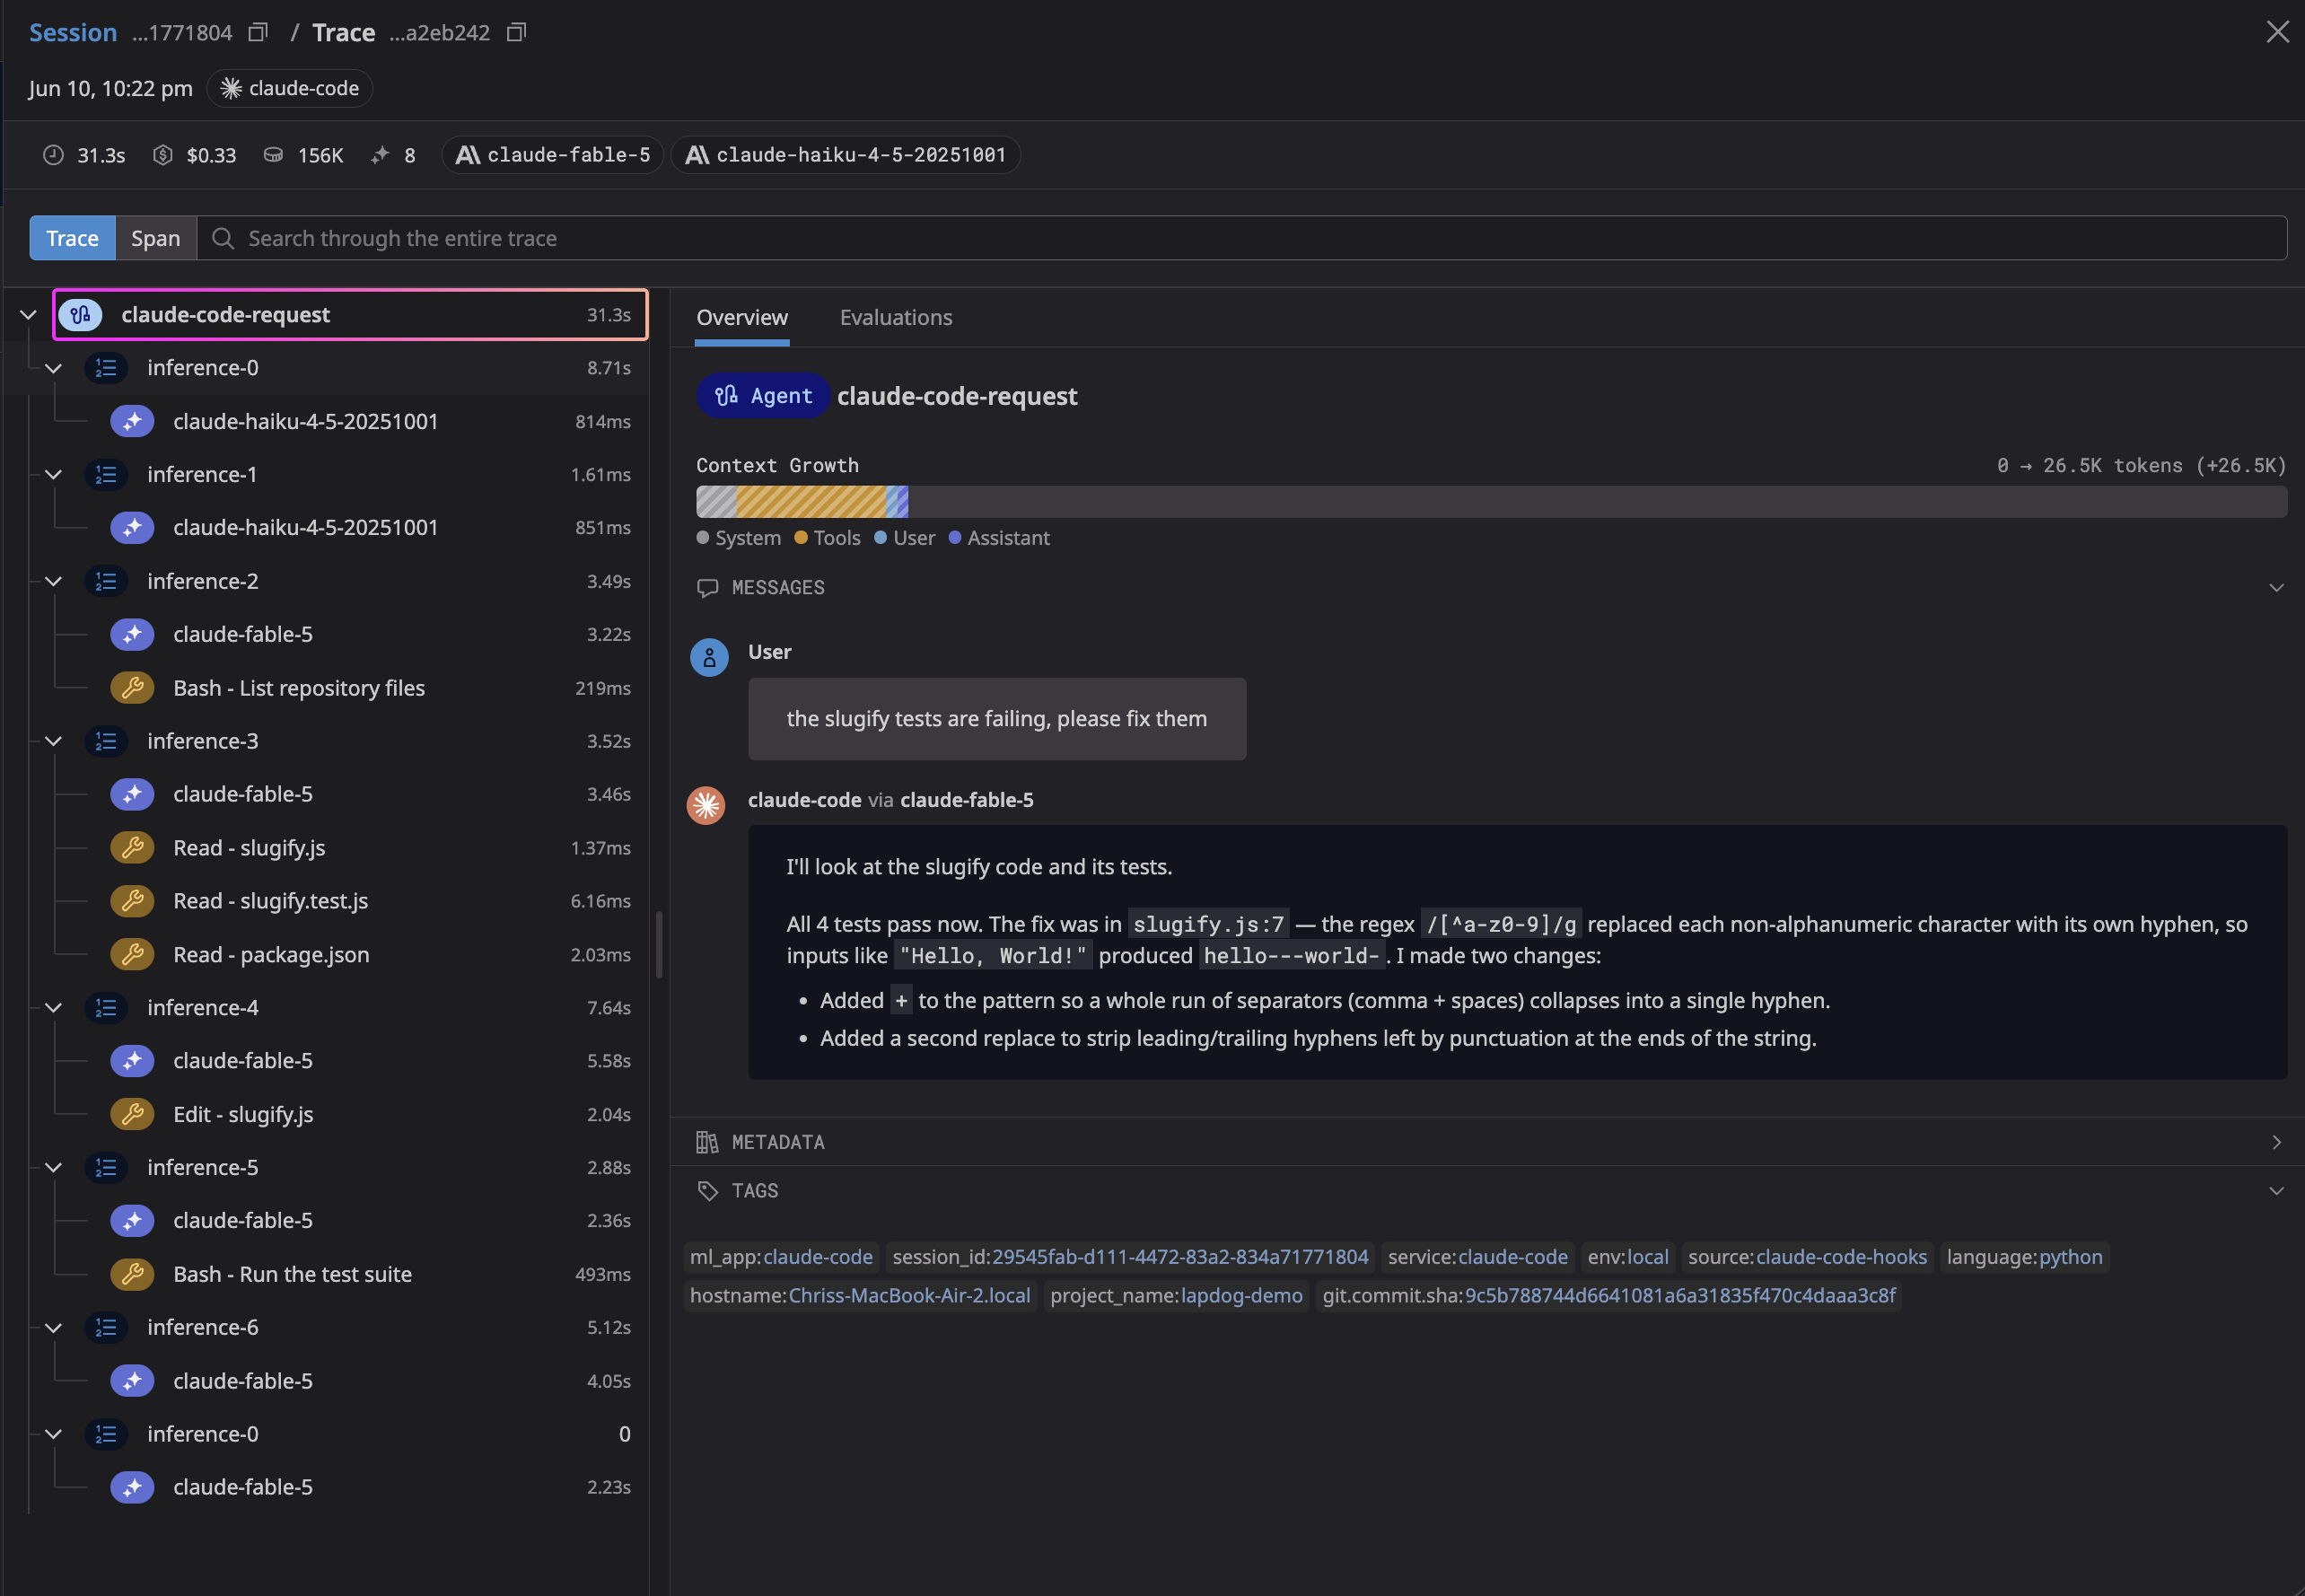
The header sums up the task. It took Fabel 5 exactly 31.3 seconds and 156K tokens to fix the failing tests for a cost of $0.33. The trace tree on the left is a log of the agent's reasoning loop: it listed the repo files, read the three it needed (slugify.js, slugify.test.js, package.json), made a single edit, then ran the suite to confirm. Look, read, fix, verify.
Click any trace step to see the exact prompt, tool call, and response for that step. You can also see the impact that steps had on overall context window utilization:
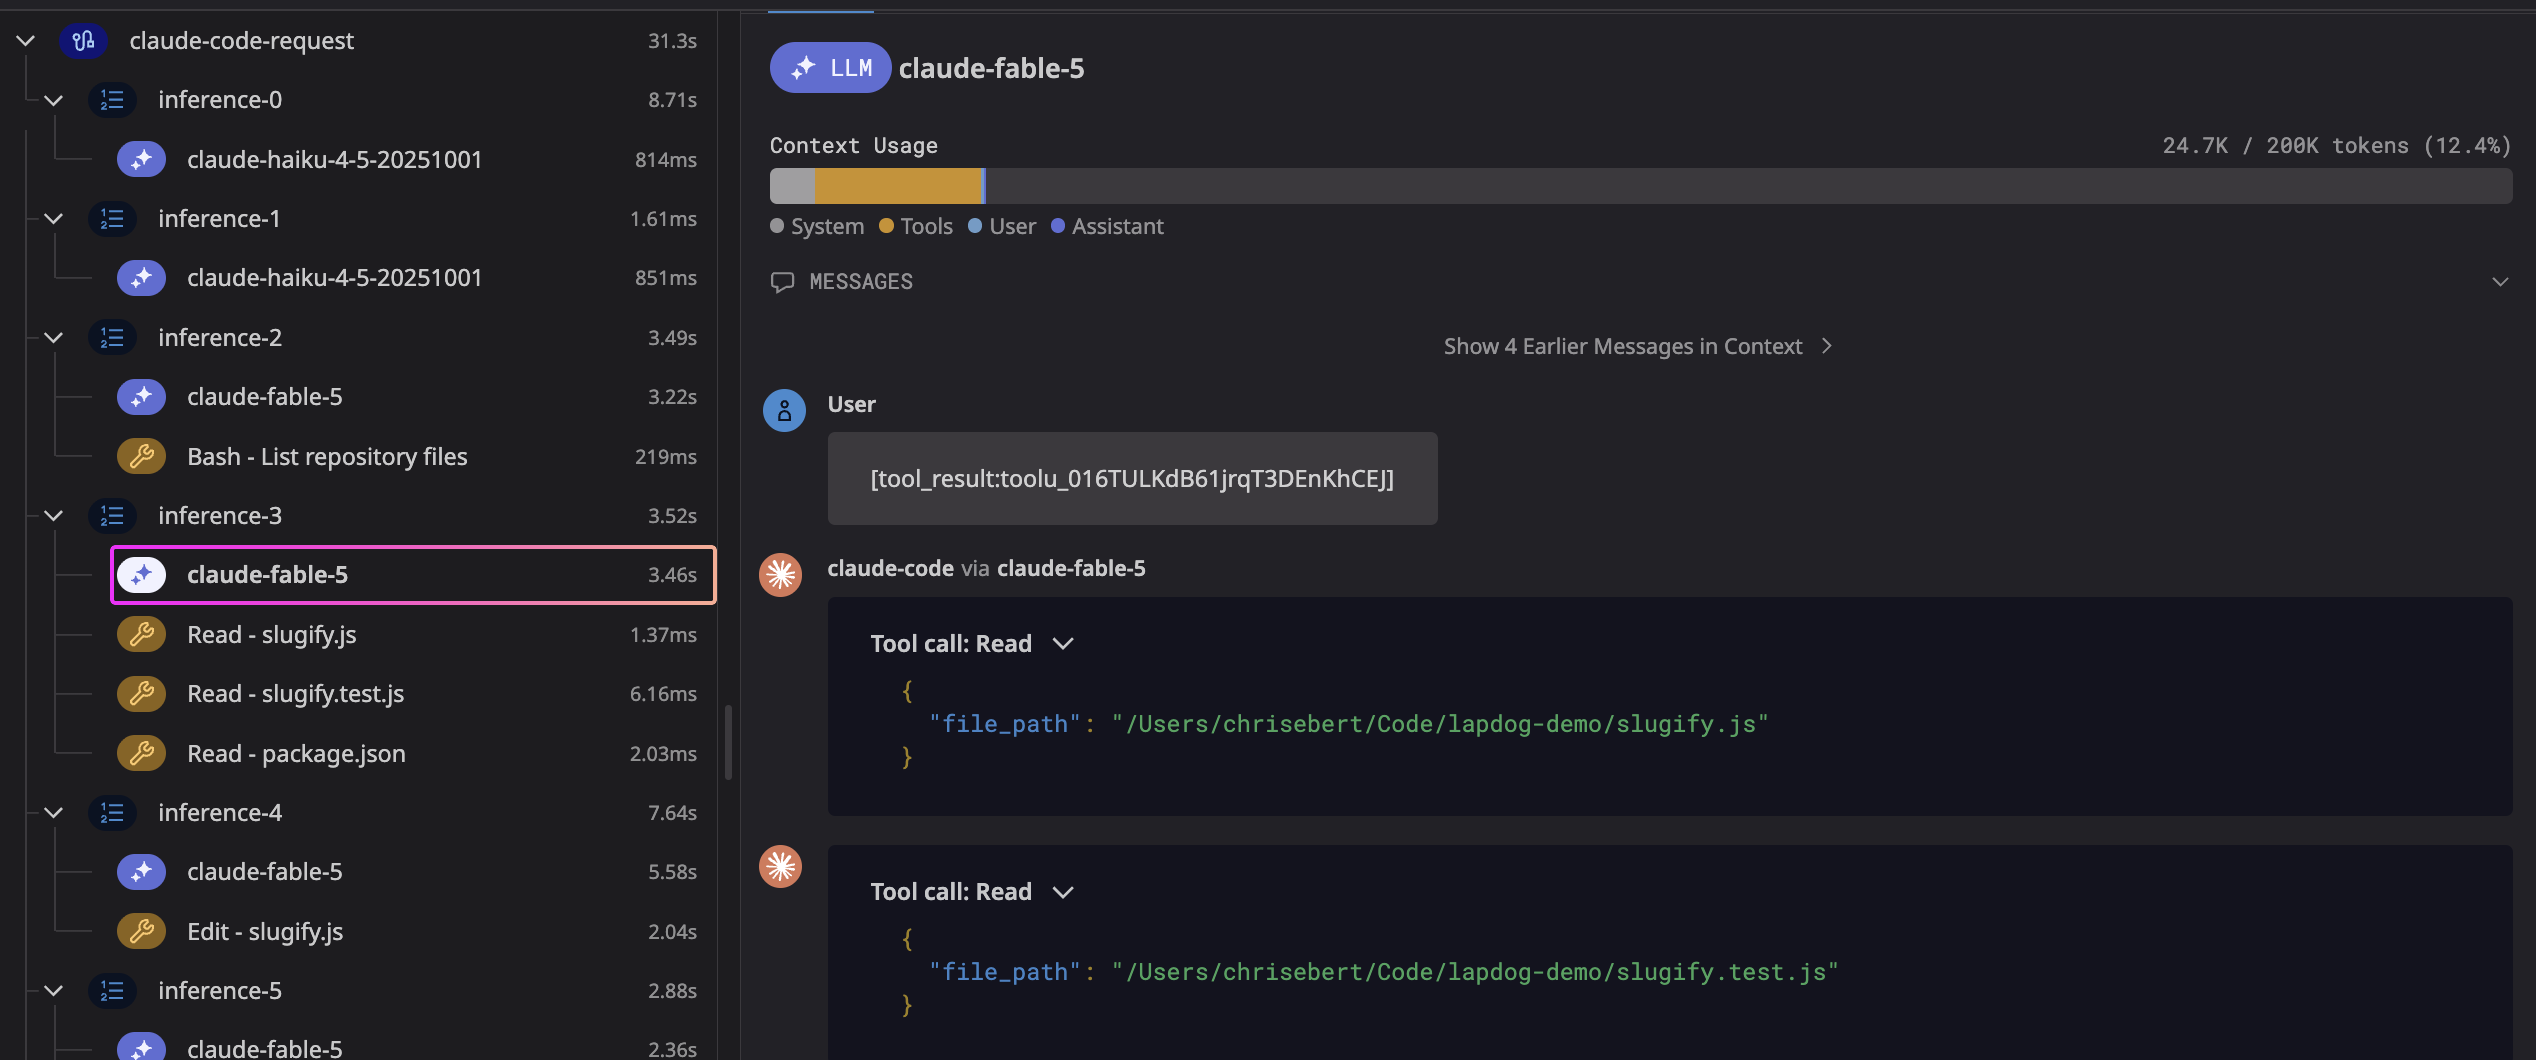
Tools like Lapdog give you a better appreciation for what coding agents are doing under the hood. The first couple of inferences ran on claude-haiku-4-5 in under a second each, while the heavier reasoning and the edit ran on claude-fable-5. The agent routed the cheap, fast steps to a cheap model and saved the expensive one for the work that needed it. Normally, this routing is invisible, but it is important to understand if you care about your agents' costs. Looking at these traces gives you a better intuition for how these agents actually work.
Wrapping up
Lapdog makes it easier to understand what coding agents are doing under the hood, with better visibility into context window usage and cost. Agents do a lot of work that scrolls past in the terminal, and being able to drill into a finished session makes it much easier to see what actually happened and what it cost. If you want a better handle on what your coding agents are doing, Lapdog is worth spending an afternoon on. And if it isn't for you, its easy to remove.